Overview
This page includes an overview of the key results from the paper. Although we provide them here we highly encourage you to read the paper for more in-depth discussion.
1 Best methods
These tables show the overall scores for the best performing methods on each task as well as an overall summary score. Methods that failed to run for a particular task were assigned the unintegrated ranking for that task. An asterisk after a method name (scANVI and scGen) indicates that cell identity information was passed to this method.
For more details on how methods were scored and ranked please refer to the methods section of the paper.
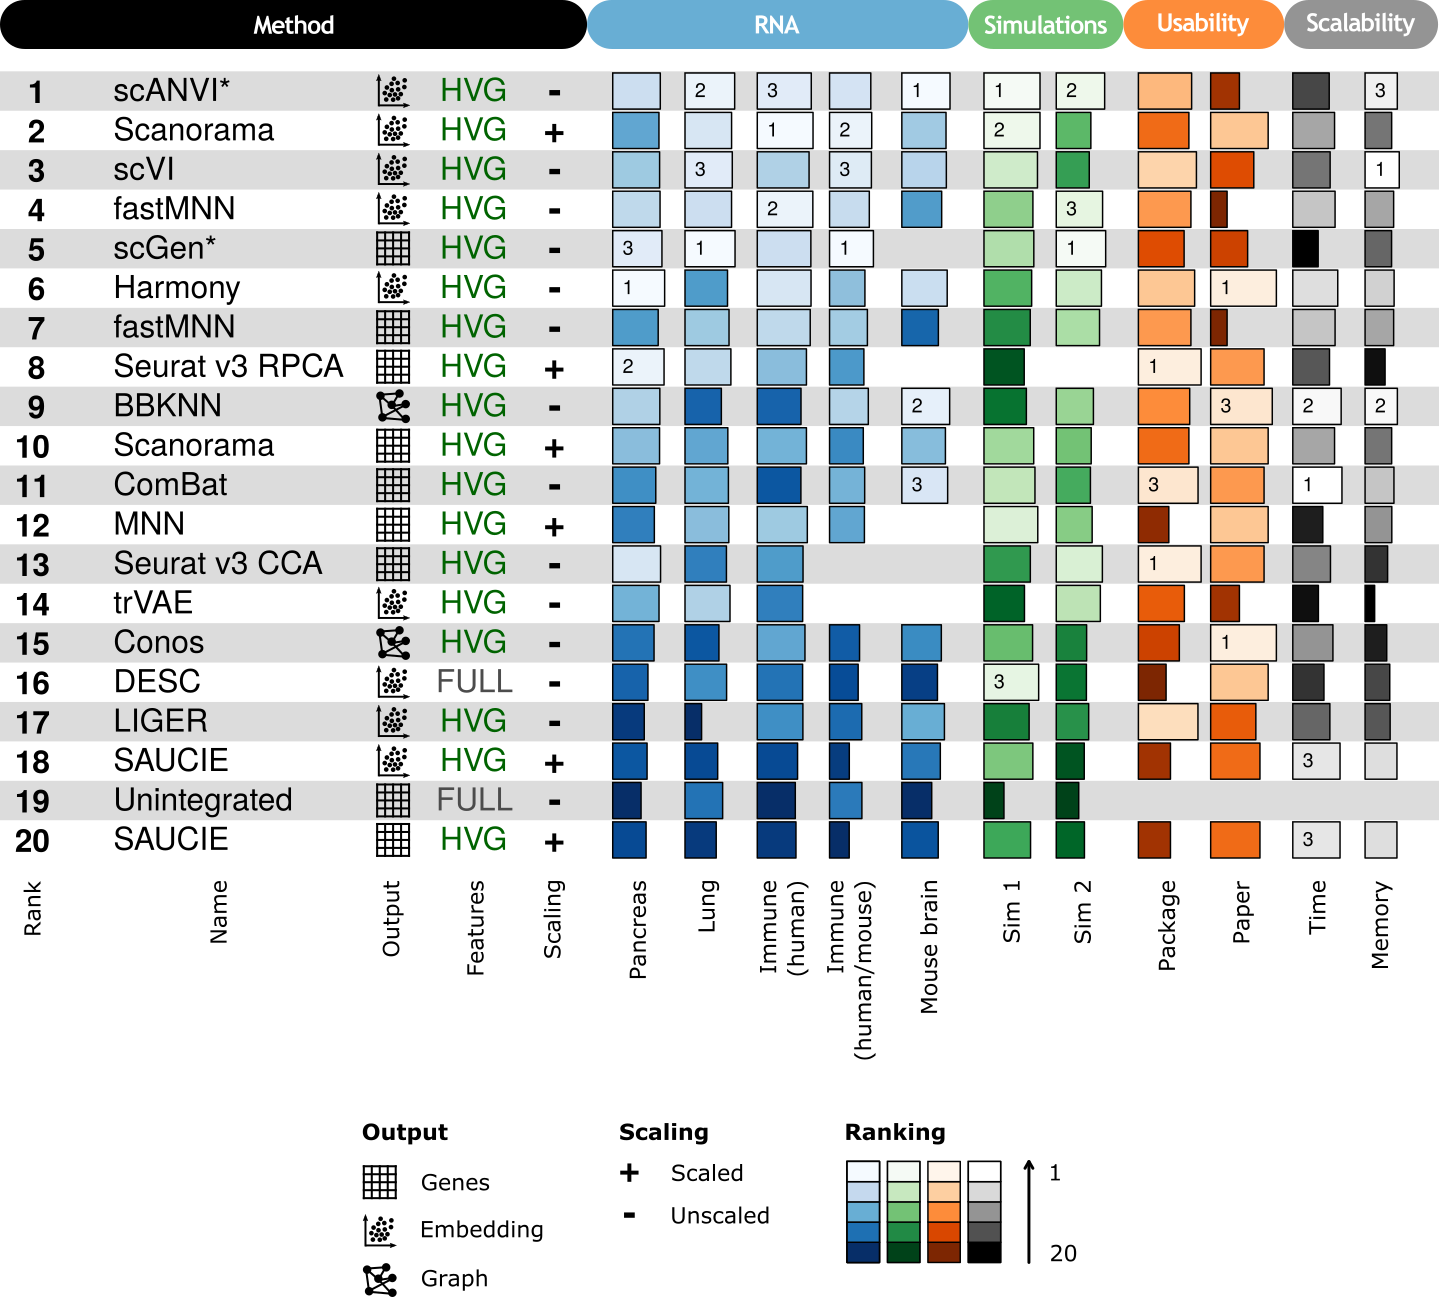
1.1 RNA
For each method we selected the best performing combination of input features and scaling and then ranked those combinations. Methods were only ranked using scores from real RNA datasets, not simulations. We also show the summarised usability and scalability scores here. For ComBat and MNN these scores correspond to the Python implementation of the methods (Scanpy and mnnpy).
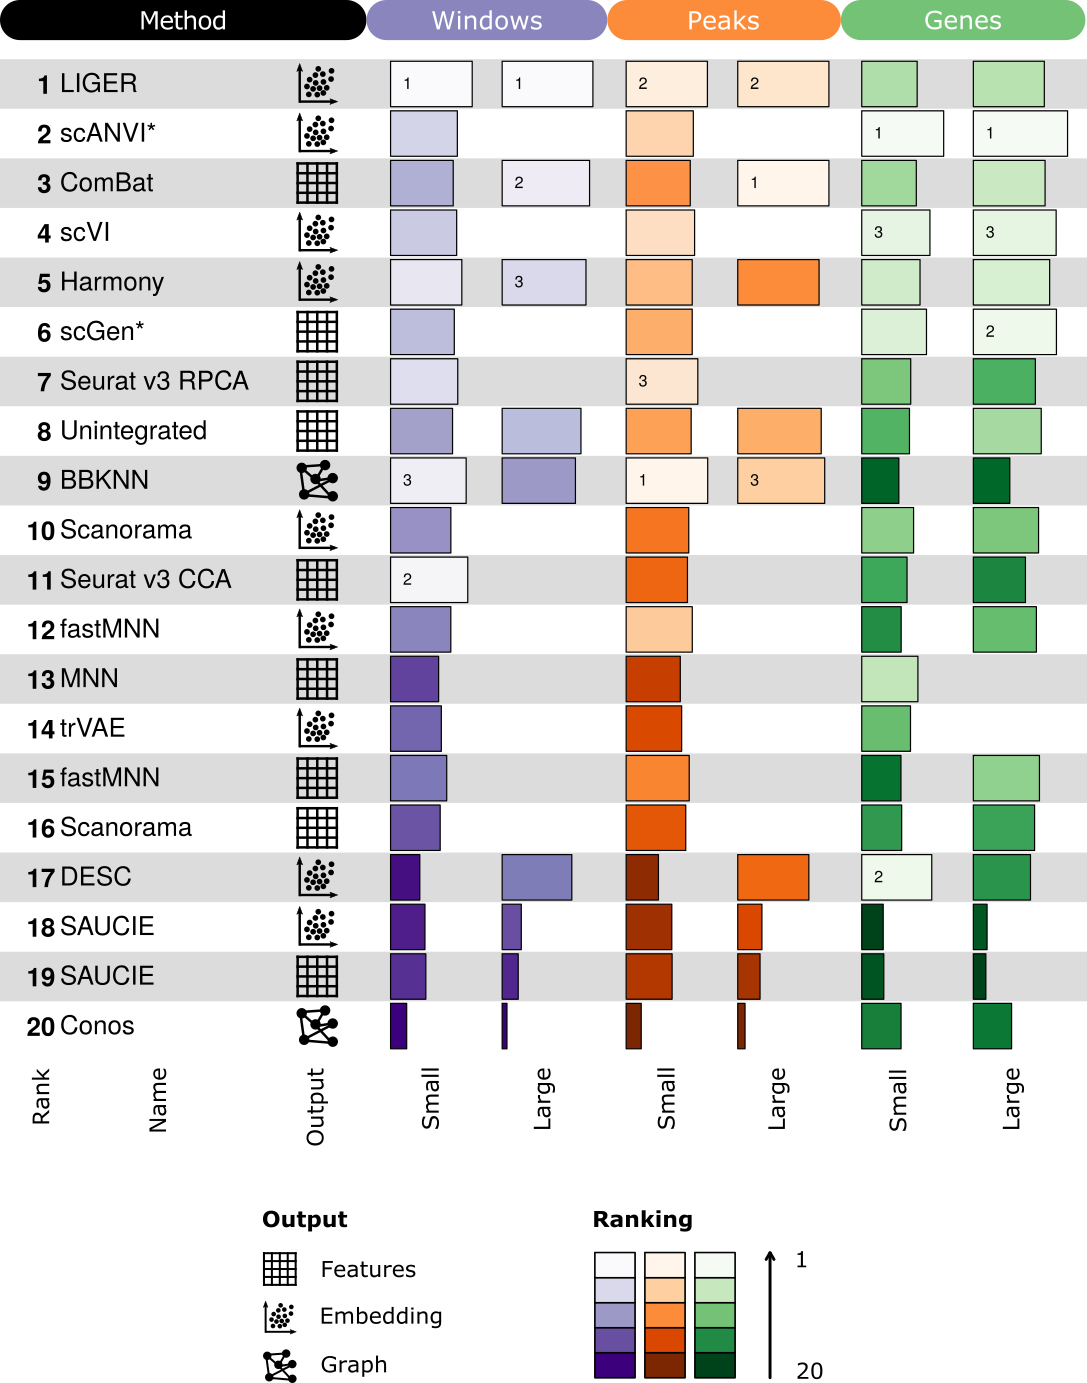
1.2 ATAC
For ATAC task considered different input features (windows, peaks, genes) as different tasks rather than pre-processing steps. Because these features are so different we don’t provide an overall summary score.
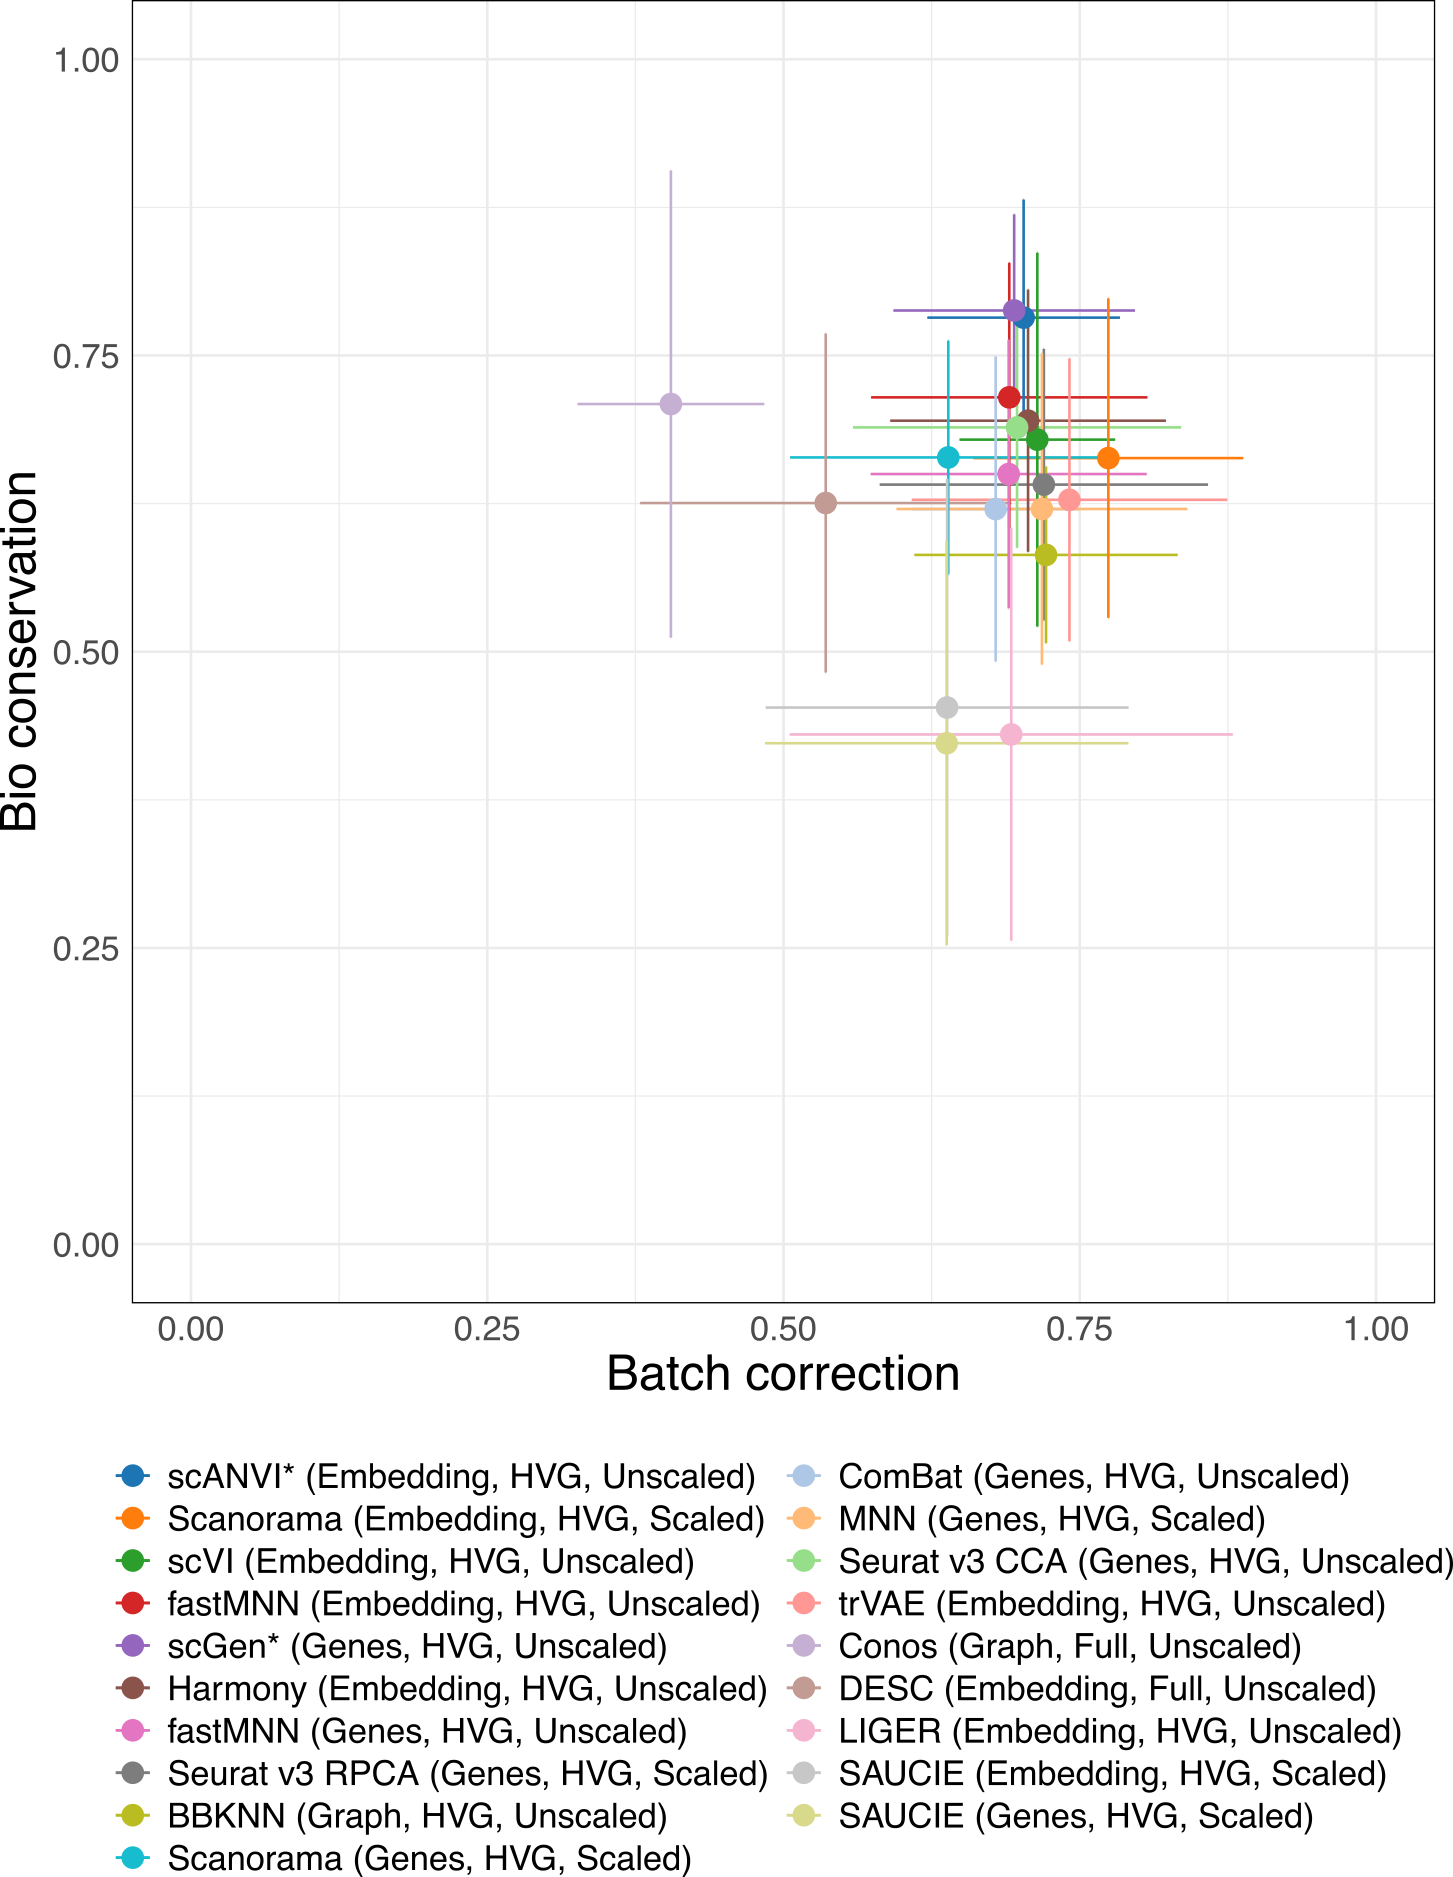
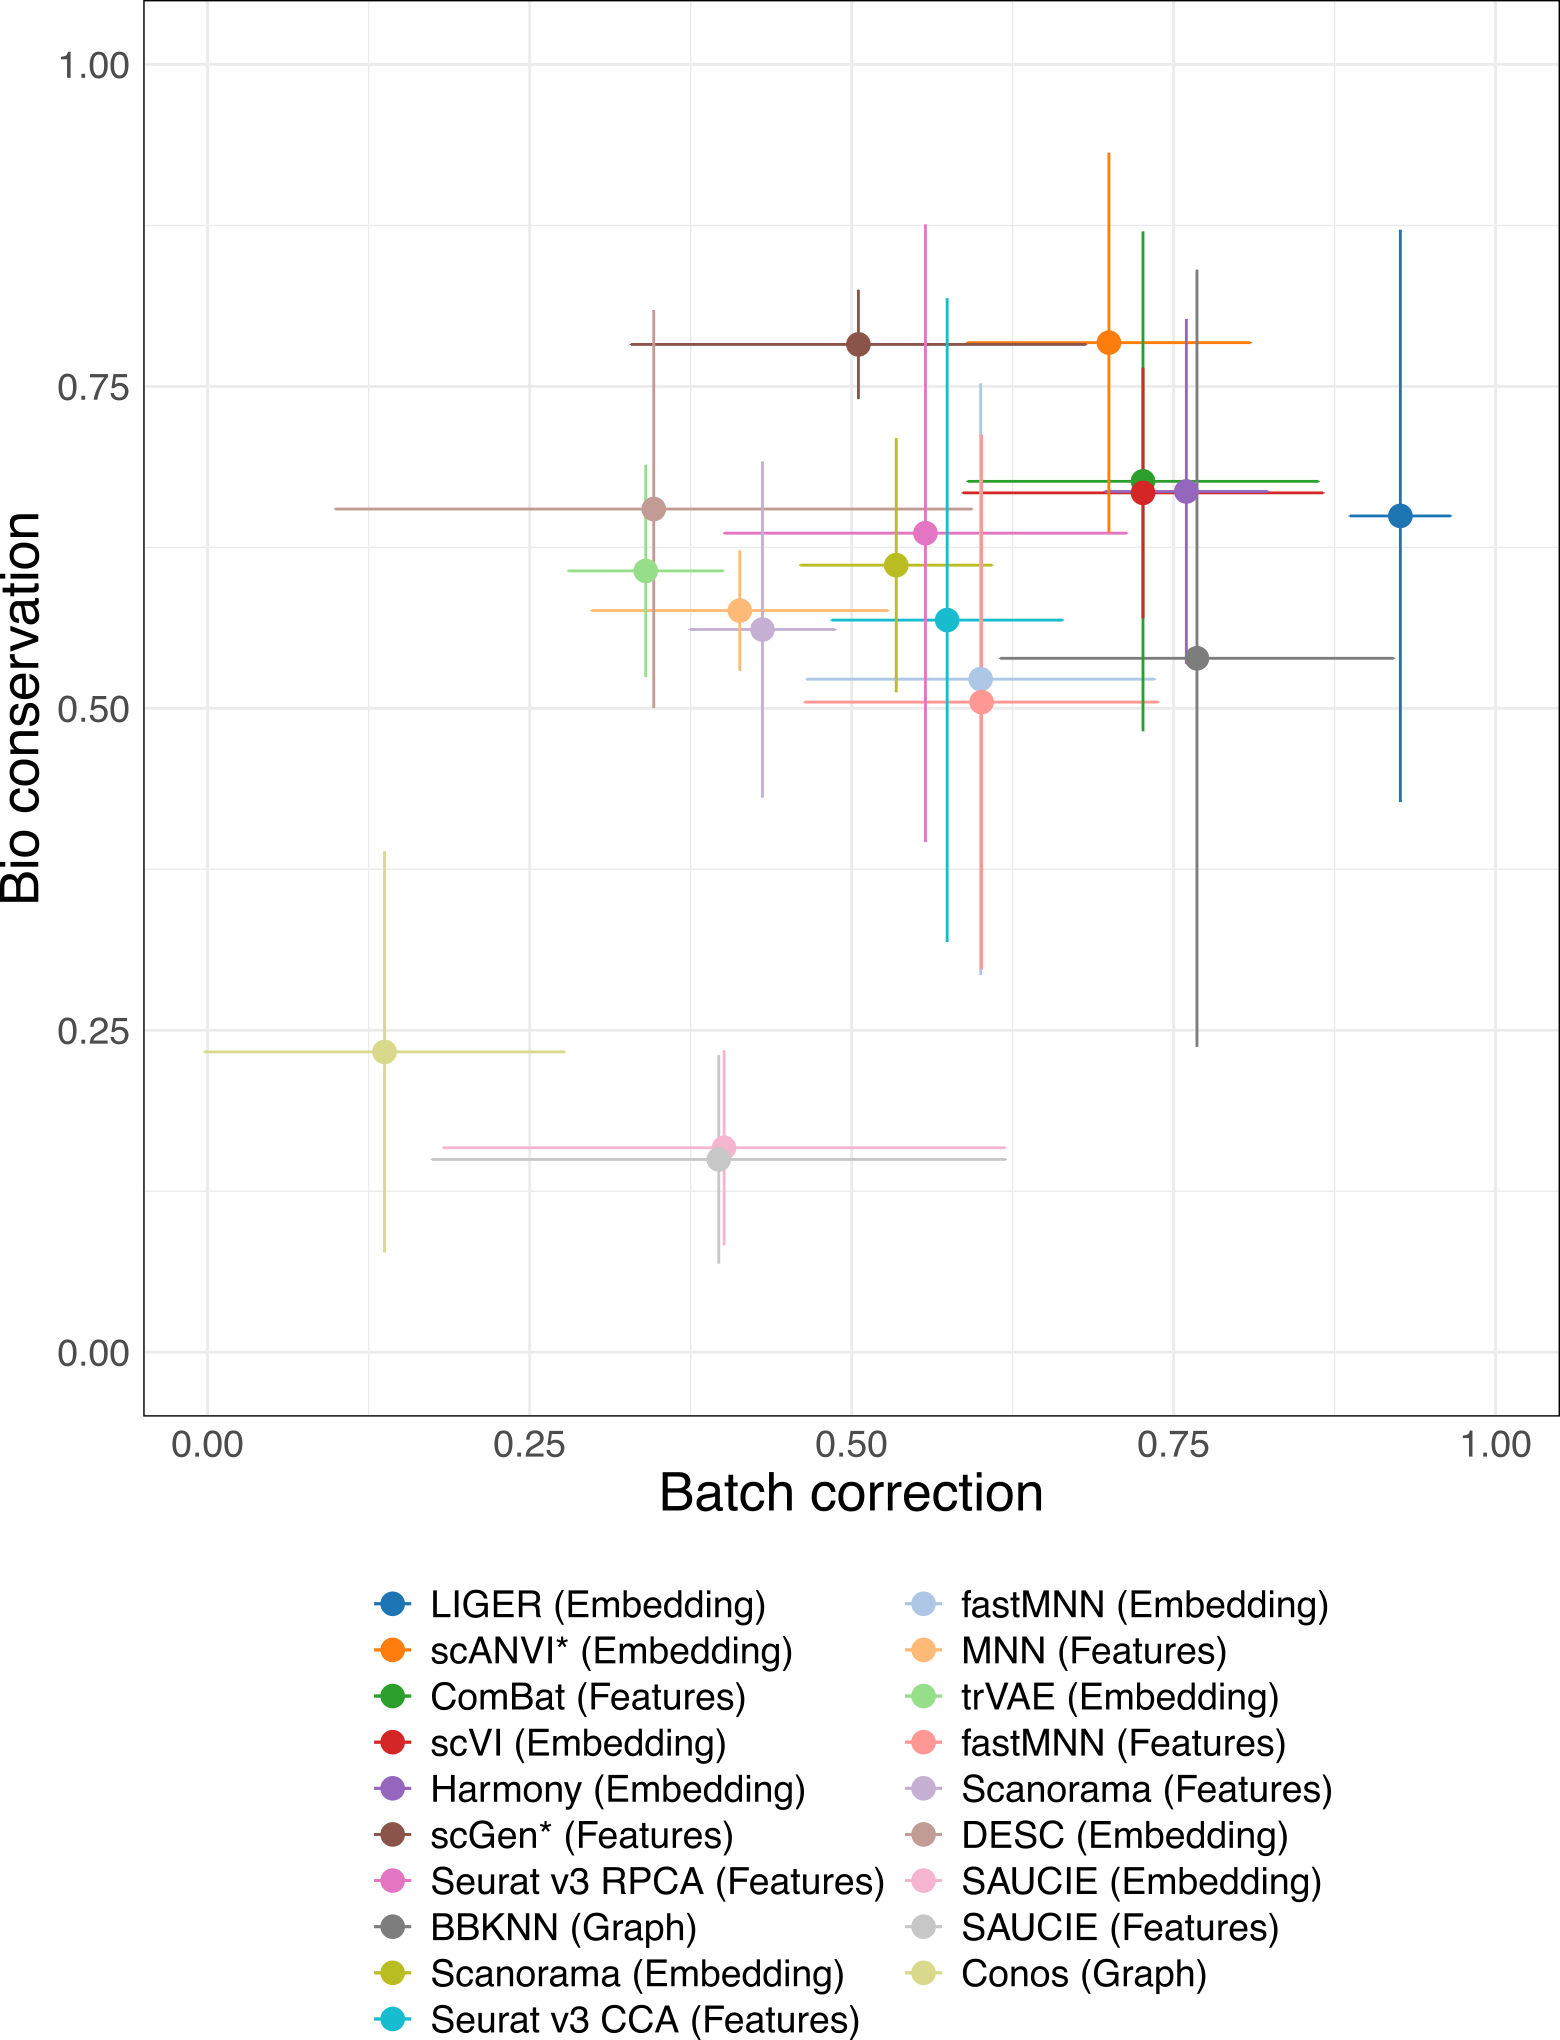
2 Batch removal vs bio-conservation
Batch removal and conservation of biological variance (bio-conservation) are often in competition with each each. These plots show the trade-off between these for each of the top method versions. Each point shows the mean across tasks and the error bars represent one standard deviation.
2.1 RNA
2.2 ATAC
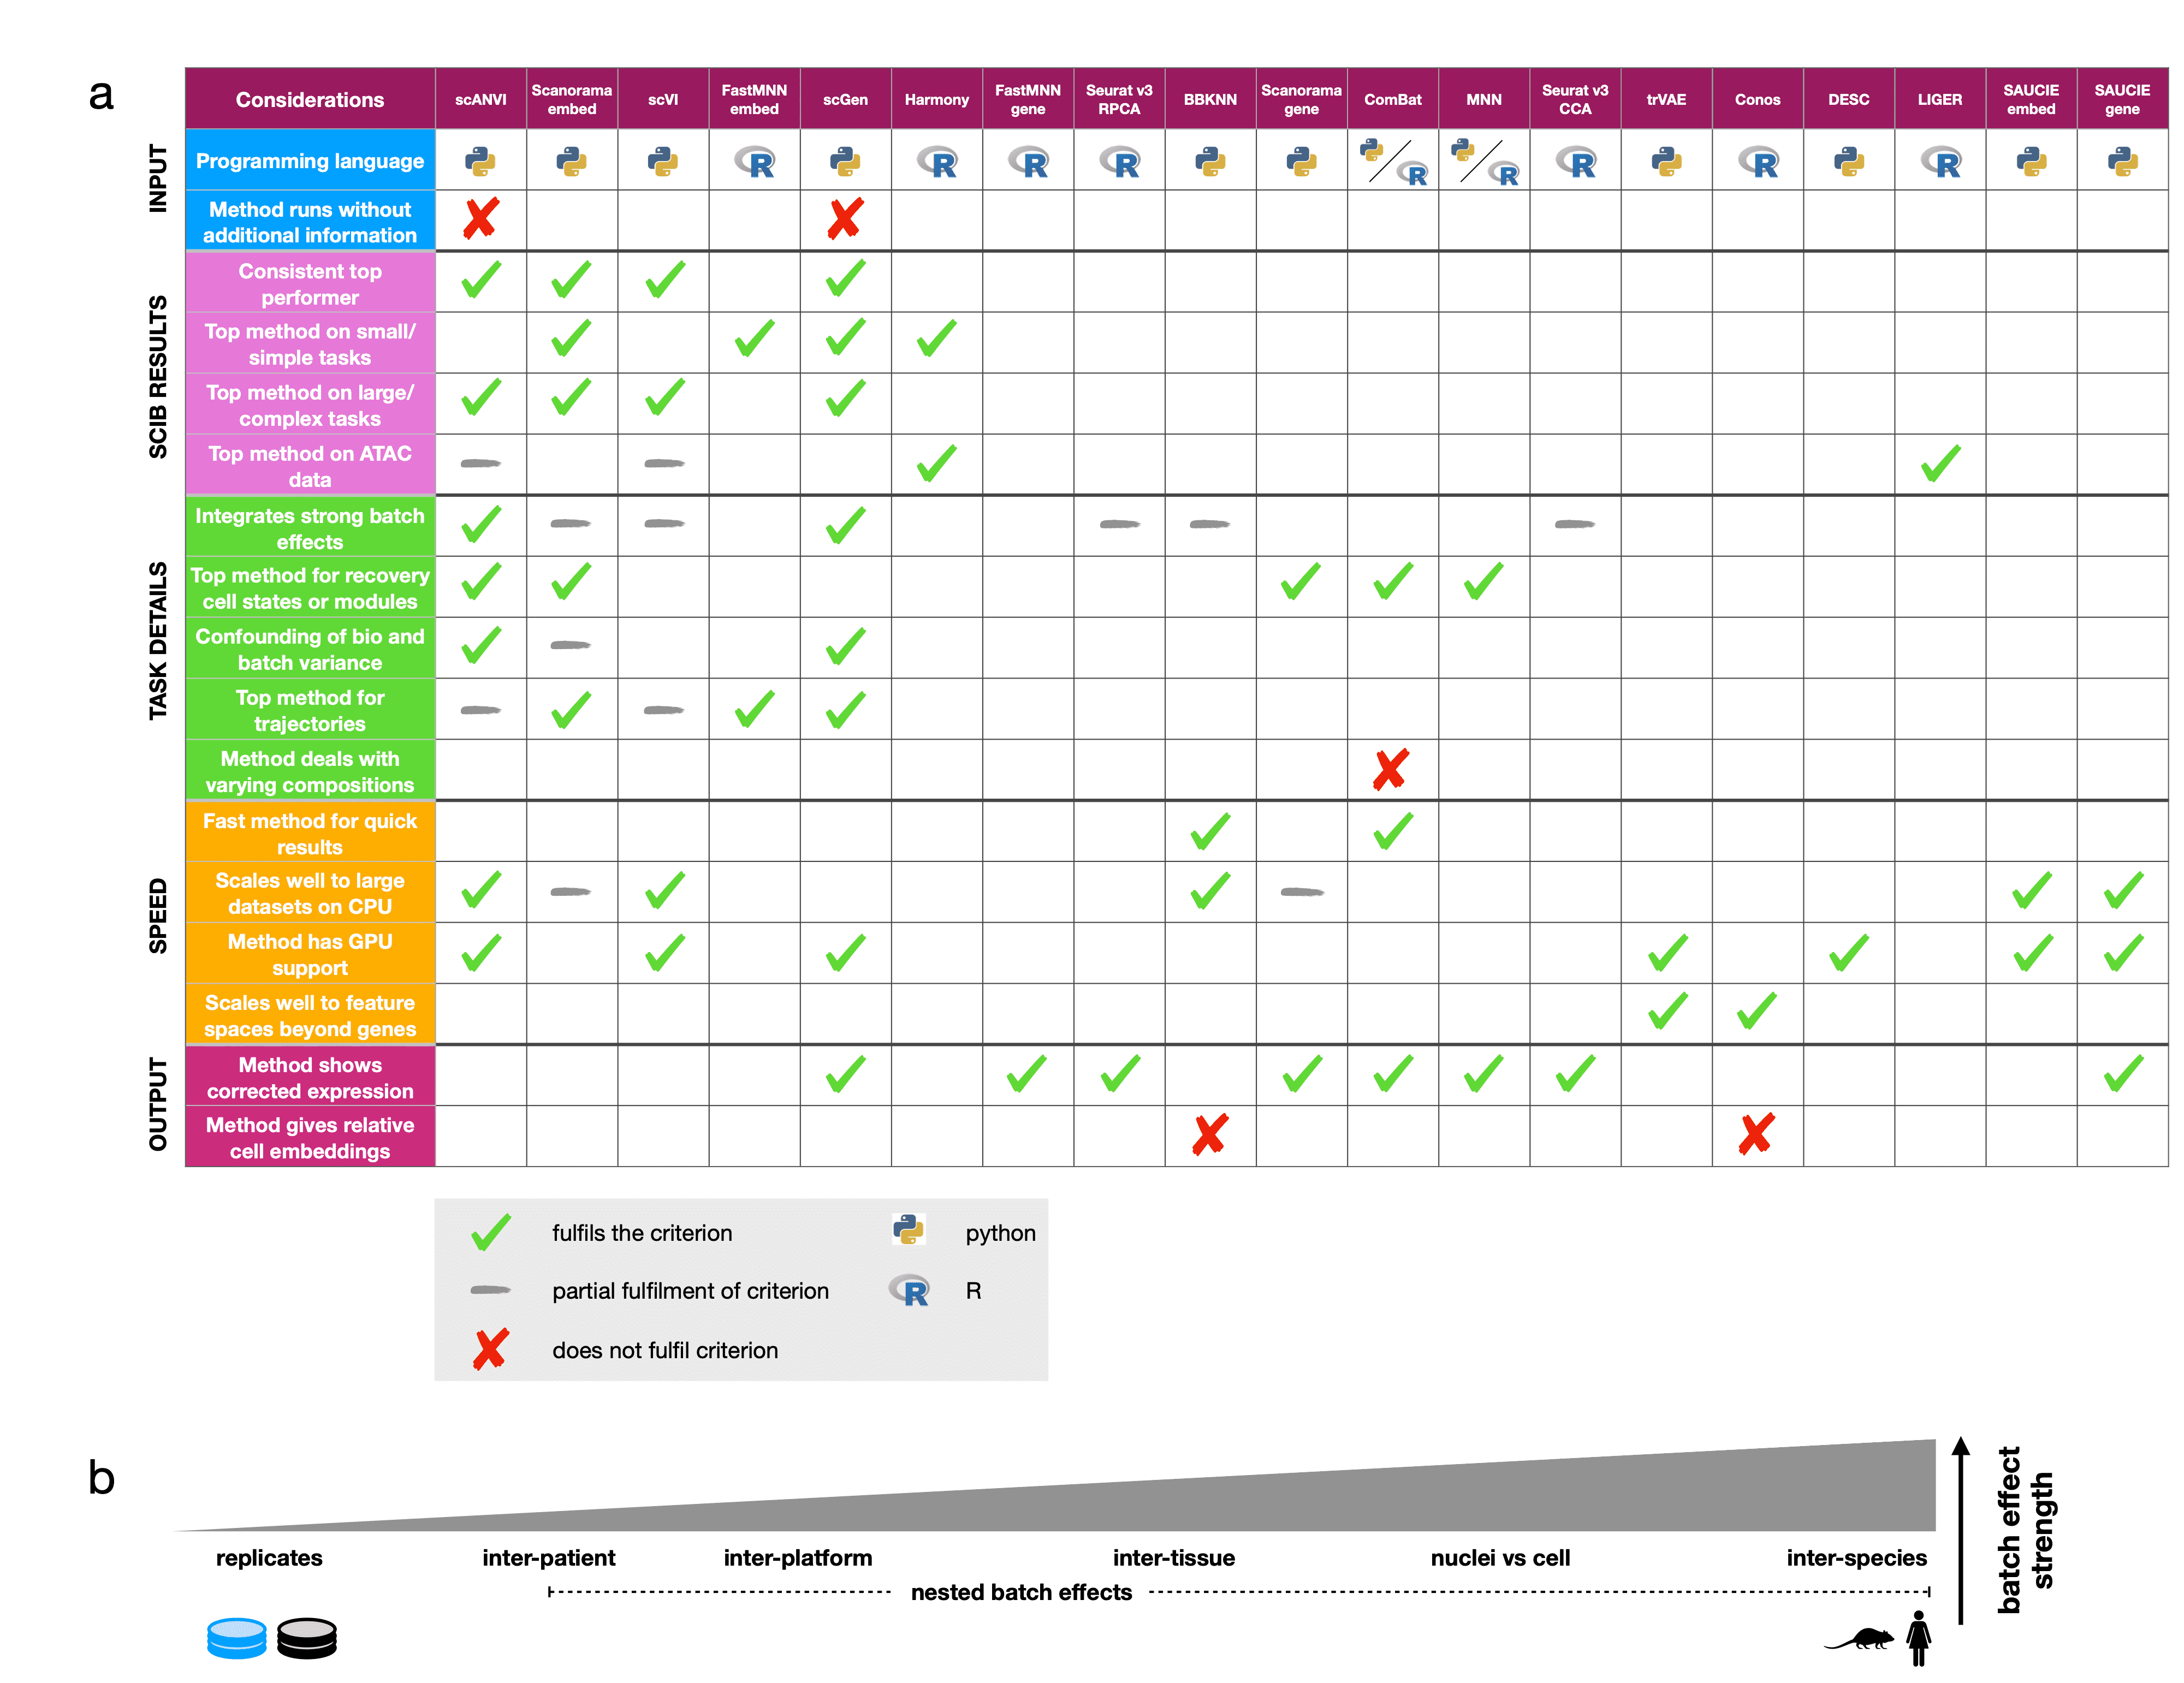
3 Summary
This table presents some of our main observations from the results of the study (click to enlarge). We hope this will be useful for deciding which methods to use for your analysis.
Ticks show which methods fulfil each criterion, grey dashes indicate partial fulfilment, and crosses are used to highlight methods that do not fulfil a criterion when more than half of the methods do. Python and R symbols indicate the primary language in which the method is programmed and used.
Considerations are divided into the five broad categories (input, scIB results, task details, speed, and output), which cover usability (input, output), scalability (speed), and expected performance (scIB results, task details). We also suggest using the scIB pipeline to test all methods on your own integration task.
Part (b) shows the relative strength of batch effect contributors in our study.