Human hematopoiesis analysis with the CytoTRACEKernel#
In this analysis, we use the CytoTRACEKernel to recover human bone marrow development. To run the analysis, ensure that
the processed data is either already saved, or generate it using the corresponding notebook in the pseudotime/
directory.
The corresponding data can be generated through the preprocessing notebooks pseudotime/preprocessing.ipynb, or
downloaded driectly from here and should be
saved in data/bone_marrow/processed/adata.h5ad, i.e.,
mkdir -p ../../data/bone_marrow/processed/
wget https://figshare.com/ndownloader/files/53394941 -O ../../data/bone_marrow/processed/adata.h5ad
Library imports#
from tqdm import tqdm

import pandas as pd

import matplotlib.pyplot as plt
import mplscience
import seaborn as sns

import anndata as ad
import cellrank as cr
import scanpy as sc
import scvelo as scv

from crp import DATA_DIR, FIG_DIR
General settings#
cr.settings.verbosity = 4
sc.settings.verbosity = 2
scv.settings.verbosity = 3
scv.settings.set_figure_params("scvelo", dpi_save=400, dpi=80, transparent=True, fontsize=20, color_map="viridis")
Constants#
SAVE_FIGURES = False
if SAVE_FIGURES:
    (FIG_DIR / "cytotracekernel").mkdir(parents=True, exist_ok=True)

FIGURE_FORMAT = "svg"
SAVE_RESULTS = True
if SAVE_RESULTS:
    (DATA_DIR / "bone_marrow" / "results").mkdir(parents=True, exist_ok=True)
TERMINAL_STATES = ["Ery", "CLP", "cDC", "pDC", "Mono"]
STATE_TRANSITIONS = [
    ("HSC", "MEP"),
    ("MEP", "Ery"),
    ("HSC", "HMP"),
    ("HMP", "Mono"),
    ("HMP", "CLP"),
    ("HMP", "DCPre"),
    ("DCPre", "pDC"),
    ("DCPre", "cDC"),
]
Function definitions#
Data loading#
adata = ad.io.read_h5ad(DATA_DIR / "bone_marrow" / "processed" / "adata.h5ad")
adata
AnnData object with n_obs × n_vars = 6881 × 1500
    obs: 'leiden', 'celltype', 'n_counts', 'palantir_pseudotime'
    var: 'highly_variable', 'means', 'dispersions', 'dispersions_norm'
    uns: 'celltype_colors', 'hvg', 'log1p', 'neighbors', 'pca', 'umap'
    obsm: 'X_diffmap', 'X_pca', 'X_umap'
    varm: 'PCs'
    obsp: 'connectivities', 'distances'
Data preprocessing#
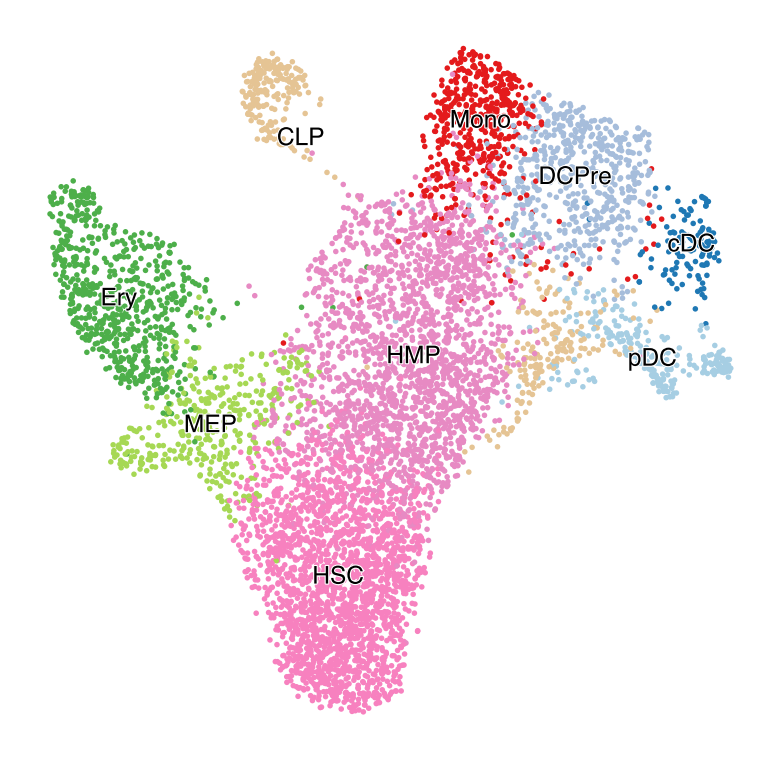
with mplscience.style_context():
    fig, ax = plt.subplots(figsize=(6, 6))
    scv.pl.scatter(adata, basis="umap", color=["celltype"], size=25, dpi=100, title="", ax=ax)
    plt.show()
adata.layers["spliced"] = adata.X
adata.layers["unspliced"] = adata.X

scv.pp.moments(adata, n_pcs=None, n_neighbors=None)
computing moments based on connectivities
    finished (0:00:00) --> added
    'Ms' and 'Mu', moments of un/spliced abundances (adata.layers)
CytoTRACEKernel#
Kernel#
ctk = cr.kernels.CytoTRACEKernel(adata)
ctk.compute_cytotrace()
Computing CytoTRACE score with `1500` genes. Consider using more than `10000` genes
DEBUG: Correlating all genes with number of genes expressed per cell
Adding `adata.obs['ct_score']`
       `adata.obs['ct_pseudotime']`
       `adata.obs['ct_num_exp_genes']`
       `adata.var['ct_gene_corr']`
       `adata.var['ct_correlates']`
       `adata.uns['ct_params']`
    Finish (0:00:00)
CytoTRACEKernel[n=6881]
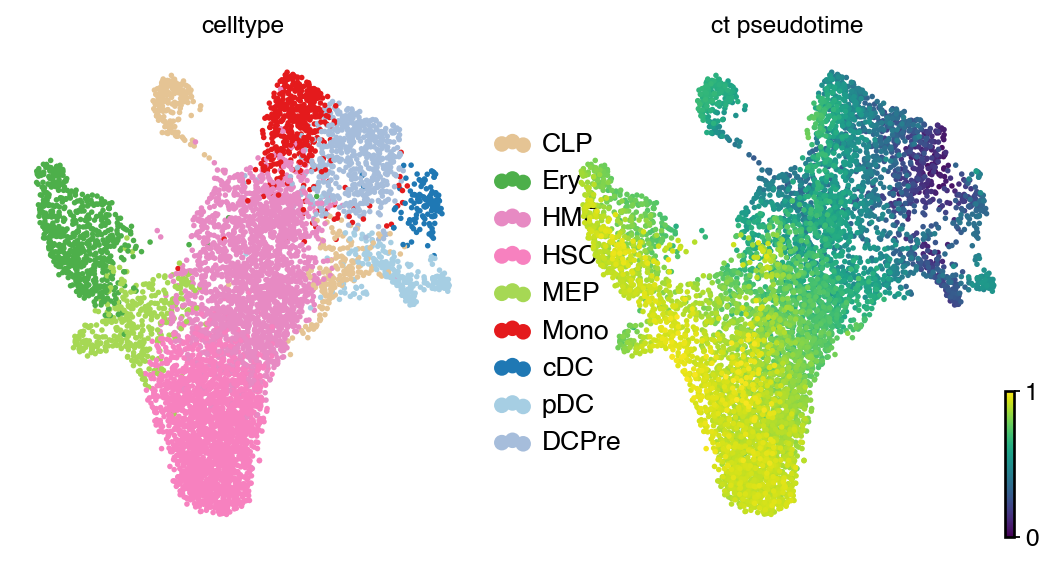
with mplscience.style_context():
    scv.pl.scatter(
        adata, basis="umap", color=["celltype", "ct_pseudotime"], legend_loc="right", color_map="viridis", size=25
    )
    plt.show()
/Users/philipp/miniforge3/envs/crp-py311/lib/python3.11/site-packages/scvelo/plotting/scatter.py:656: UserWarning: No data for colormapping provided via 'c'. Parameters 'cmap' will be ignored
  smp = ax.scatter(
ctk.compute_transition_matrix(threshold_scheme="soft", nu=0.5)
Computing transition matrix based on pseudotime
Finish (0:00:00)
CytoTRACEKernel[n=6881, dnorm=False, scheme='soft', b=10.0, nu=0.5]
Estimator#
estimator = cr.estimators.GPCCA(ctk)
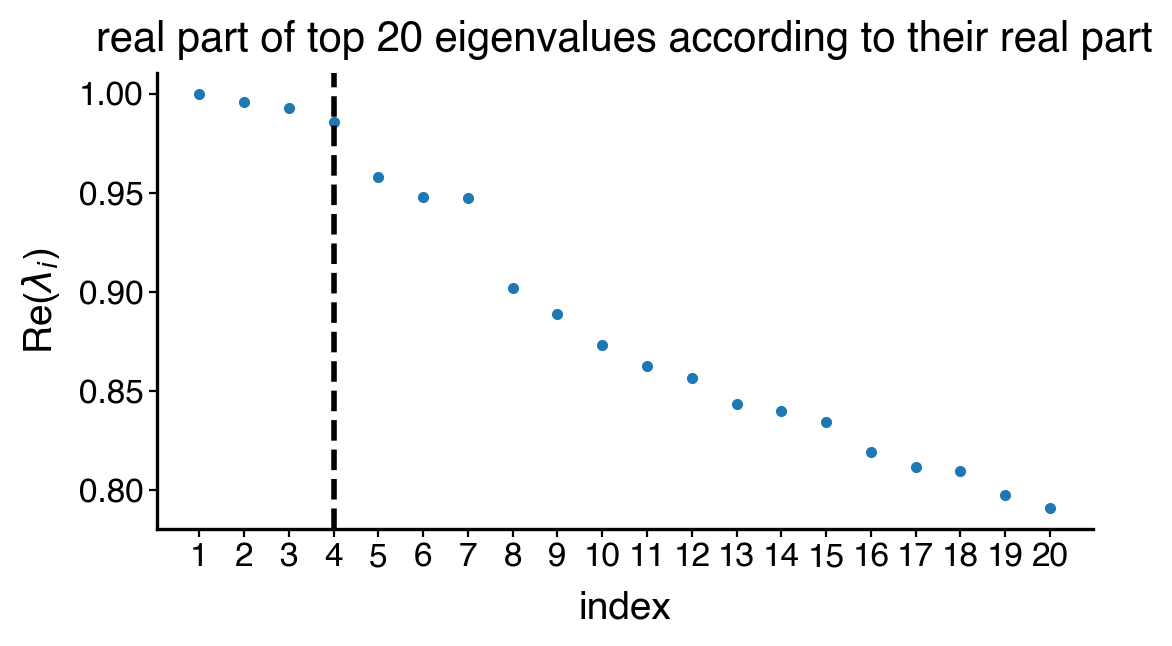
estimator.compute_schur(n_components=20)
with mplscience.style_context():
if SAVE_FIGURES:
save = FIG_DIR / "cytotracekernel" / f"spectrum.{FIGURE_FORMAT}"
else:
save = False
estimator.plot_spectrum(real_only=True, figsize=(6, 3), save=save)
plt.show()
Computing Schur decomposition
Adding `adata.uns['eigendecomposition_fwd']`
       `.schur_vectors`
       `.schur_matrix`
       `.eigendecomposition`
    Finish (0:00:01)
estimator.compute_macrostates(4, cluster_key="celltype")

with mplscience.style_context():
    estimator.plot_macrostates(which="all", basis="umap", legend_loc="right", title="", size=100)
    if SAVE_FIGURES:
        fig, ax = plt.subplots(figsize=(6, 6))
        estimator.plot_macrostates(which="all", basis="umap", legend_loc=False, title="", size=100, ax=ax)
        fig.savefig(
            FIG_DIR / "cytotracekernel" / "4_macrostates.png",
            dpi=400,
            transparent=True,
            bbox_inches="tight",
        )

    plt.show()
Computing `4` macrostates
DEBUG: Setting the macrostates using macrostates memberships
DEBUG: Raising an exception if there are less than `6` cells.
Adding `.macrostates`
       `.macrostates_memberships`
       `.coarse_T`
       `.coarse_initial_distribution
       `.coarse_stationary_distribution`
       `.schur_vectors`
       `.schur_matrix`
       `.eigendecomposition`
    Finish (0:00:00)
/Users/philipp/miniforge3/envs/crp-py311/lib/python3.11/site-packages/scvelo/plotting/scatter.py:656: UserWarning: No data for colormapping provided via 'c'. Parameters 'cmap' will be ignored
  smp = ax.scatter(
/Users/philipp/miniforge3/envs/crp-py311/lib/python3.11/site-packages/scvelo/plotting/scatter.py:694: UserWarning: No data for colormapping provided via 'c'. Parameters 'cmap' will be ignored
  ax.scatter(
/Users/philipp/miniforge3/envs/crp-py311/lib/python3.11/site-packages/scvelo/plotting/utils.py:1396: UserWarning: No data for colormapping provided via 'c'. Parameters 'cmap' will be ignored
  ax.scatter(x, y, s=bg_size, marker=".", c=bg_color, zorder=zord - 2, **kwargs)
/Users/philipp/miniforge3/envs/crp-py311/lib/python3.11/site-packages/scvelo/plotting/utils.py:1397: UserWarning: No data for colormapping provided via 'c'. Parameters 'cmap' will be ignored
  ax.scatter(x, y, s=gp_size, marker=".", c=gp_color, zorder=zord - 1, **kwargs)

estimator.compute_macrostates(7, cluster_key="celltype")

with mplscience.style_context():
    estimator.plot_macrostates(which="all", basis="umap", legend_loc="right", title="", size=100)
    if SAVE_FIGURES:
        fig, ax = plt.subplots(figsize=(6, 6))
        estimator.plot_macrostates(which="all", basis="umap", legend_loc=False, title="", size=100, ax=ax)
        fig.savefig(
            FIG_DIR / "cytotracekernel" / "7_macrostates.png",
            dpi=400,
            transparent=True,
            bbox_inches="tight",
        )

    plt.show()
Computing `7` macrostates
DEBUG: Setting the macrostates using macrostates memberships
DEBUG: Raising an exception if there are less than `6` cells.
Adding `.macrostates`
       `.macrostates_memberships`
       `.coarse_T`
       `.coarse_initial_distribution
       `.coarse_stationary_distribution`
       `.schur_vectors`
       `.schur_matrix`
       `.eigendecomposition`
    Finish (0:00:00)
/Users/philipp/miniforge3/envs/crp-py311/lib/python3.11/site-packages/scvelo/plotting/scatter.py:656: UserWarning: No data for colormapping provided via 'c'. Parameters 'cmap' will be ignored
  smp = ax.scatter(
/Users/philipp/miniforge3/envs/crp-py311/lib/python3.11/site-packages/scvelo/plotting/scatter.py:694: UserWarning: No data for colormapping provided via 'c'. Parameters 'cmap' will be ignored
  ax.scatter(
/Users/philipp/miniforge3/envs/crp-py311/lib/python3.11/site-packages/scvelo/plotting/utils.py:1396: UserWarning: No data for colormapping provided via 'c'. Parameters 'cmap' will be ignored
  ax.scatter(x, y, s=bg_size, marker=".", c=bg_color, zorder=zord - 2, **kwargs)
/Users/philipp/miniforge3/envs/crp-py311/lib/python3.11/site-packages/scvelo/plotting/utils.py:1397: UserWarning: No data for colormapping provided via 'c'. Parameters 'cmap' will be ignored
  ax.scatter(x, y, s=gp_size, marker=".", c=gp_color, zorder=zord - 1, **kwargs)
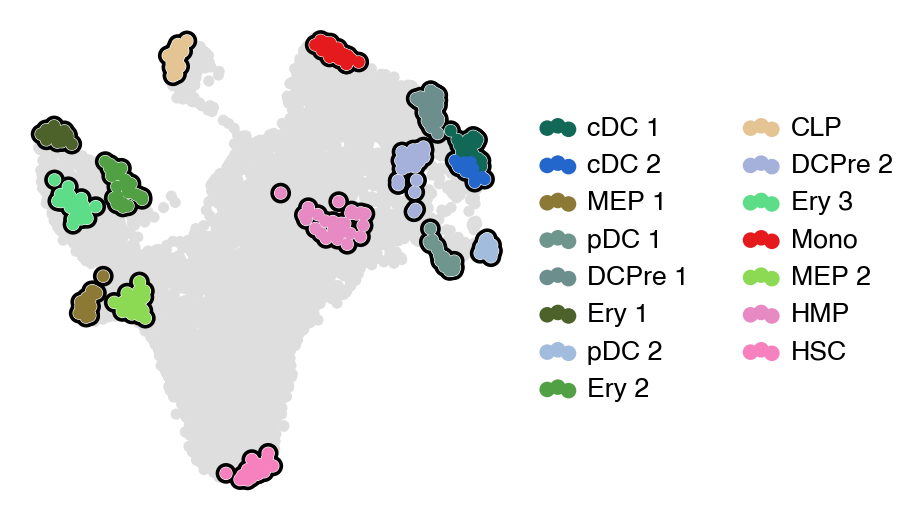
estimator.compute_macrostates(15, cluster_key="celltype")

with mplscience.style_context():
    estimator.plot_macrostates(which="all", basis="umap", legend_loc="right", title="", size=100)
    if SAVE_FIGURES:
        fig, ax = plt.subplots(figsize=(6, 6))
        estimator.plot_macrostates(which="all", basis="umap", legend_loc=False, title="", size=100, ax=ax)
        fig.savefig(
            FIG_DIR / "cytotracekernel" / "15_macrostates.png",
            dpi=400,
            transparent=True,
            bbox_inches="tight",
        )

    plt.show()
Computing `15` macrostates
DEBUG: Setting the macrostates using macrostates memberships
DEBUG: Raising an exception if there are less than `6` cells.
WARNING: The following terminal states have different number of cells than requested (30): {'cDC_2': 27}
Adding `.macrostates`
       `.macrostates_memberships`
       `.coarse_T`
       `.coarse_initial_distribution
       `.coarse_stationary_distribution`
       `.schur_vectors`
       `.schur_matrix`
       `.eigendecomposition`
    Finish (0:00:16)
/Users/philipp/miniforge3/envs/crp-py311/lib/python3.11/site-packages/scvelo/plotting/scatter.py:656: UserWarning: No data for colormapping provided via 'c'. Parameters 'cmap' will be ignored
  smp = ax.scatter(
/Users/philipp/miniforge3/envs/crp-py311/lib/python3.11/site-packages/scvelo/plotting/scatter.py:694: UserWarning: No data for colormapping provided via 'c'. Parameters 'cmap' will be ignored
  ax.scatter(
/Users/philipp/miniforge3/envs/crp-py311/lib/python3.11/site-packages/scvelo/plotting/utils.py:1396: UserWarning: No data for colormapping provided via 'c'. Parameters 'cmap' will be ignored
  ax.scatter(x, y, s=bg_size, marker=".", c=bg_color, zorder=zord - 2, **kwargs)
/Users/philipp/miniforge3/envs/crp-py311/lib/python3.11/site-packages/scvelo/plotting/utils.py:1397: UserWarning: No data for colormapping provided via 'c'. Parameters 'cmap' will be ignored
  ax.scatter(x, y, s=gp_size, marker=".", c=gp_color, zorder=zord - 1, **kwargs)
cluster_key = "celltype"
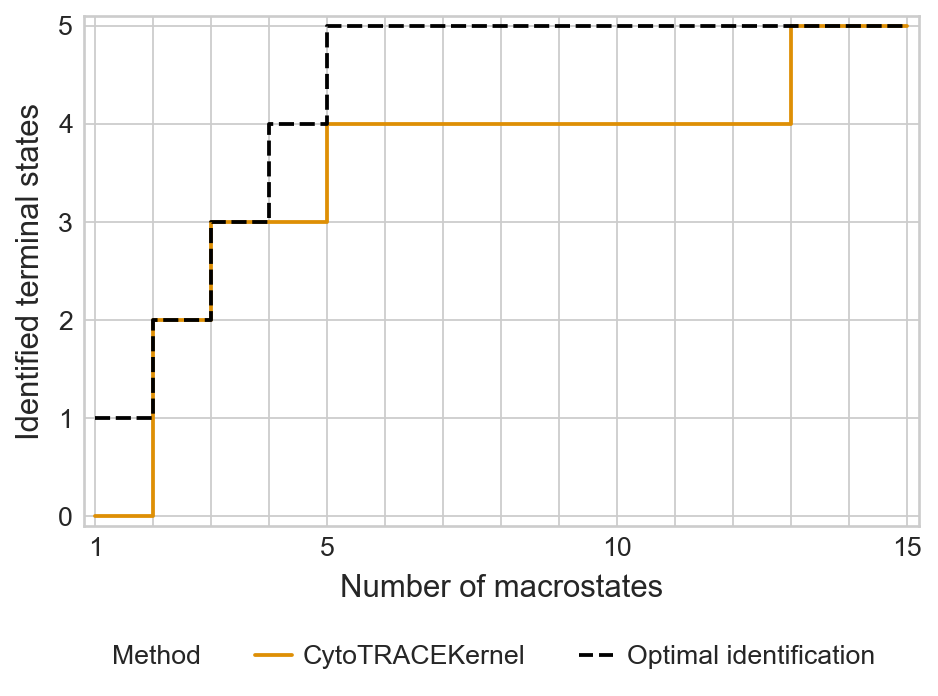
tsi_score = estimator.tsi(n_macrostates=15, terminal_states=TERMINAL_STATES, cluster_key=cluster_key)
print(f"TSI score: {tsi_score:.2f}")
if SAVE_RESULTS:
estimator._tsi.to_df().to_parquet(DATA_DIR / "bone_marrow" / "results" / "ct_tsi.parquet")
Computing `15` macrostates
DEBUG: Setting the macrostates using macrostates memberships
DEBUG: Raising an exception if there are less than `6` cells.
WARNING: The following terminal states have different number of cells than requested (30): {'cDC_2': 27}
Adding `.macrostates`
       `.macrostates_memberships`
       `.coarse_T`
       `.coarse_initial_distribution
       `.coarse_stationary_distribution`
       `.schur_vectors`
       `.schur_matrix`
       `.eigendecomposition`
    Finish (0:00:16)
Computing `14` macrostates
DEBUG: Setting the macrostates using macrostates memberships
DEBUG: Raising an exception if there are less than `6` cells.
Adding `.macrostates`
       `.macrostates_memberships`
       `.coarse_T`
       `.coarse_initial_distribution
       `.coarse_stationary_distribution`
       `.schur_vectors`
       `.schur_matrix`
       `.eigendecomposition`
    Finish (0:00:12)
Computing `13` macrostates
DEBUG: Setting the macrostates using macrostates memberships
DEBUG: Raising an exception if there are less than `6` cells.
WARNING: The following terminal states have different number of cells than requested (30): {'cDC_1': 28}
Adding `.macrostates`
       `.macrostates_memberships`
       `.coarse_T`
       `.coarse_initial_distribution
       `.coarse_stationary_distribution`
       `.schur_vectors`
       `.schur_matrix`
       `.eigendecomposition`
    Finish (0:00:06)
Computing `12` macrostates
DEBUG: Setting the macrostates using macrostates memberships
DEBUG: Raising an exception if there are less than `6` cells.
Computing `11` macrostates
DEBUG: Setting the macrostates using macrostates memberships
DEBUG: Raising an exception if there are less than `6` cells.
Adding `.macrostates`
       `.macrostates_memberships`
       `.coarse_T`
       `.coarse_initial_distribution
       `.coarse_stationary_distribution`
       `.schur_vectors`
       `.schur_matrix`
       `.eigendecomposition`
    Finish (0:00:07)
Computing `10` macrostates
DEBUG: Setting the macrostates using macrostates memberships
DEBUG: Raising an exception if there are less than `6` cells.
WARNING: The following terminal states have different number of cells than requested (30): {'cDC_1': 27, 'cDC_2': 7}
Adding `.macrostates`
       `.macrostates_memberships`
       `.coarse_T`
       `.coarse_initial_distribution
       `.coarse_stationary_distribution`
       `.schur_vectors`
       `.schur_matrix`
       `.eigendecomposition`
    Finish (0:00:05)
Computing `9` macrostates
DEBUG: Setting the macrostates using macrostates memberships
DEBUG: Raising an exception if there are less than `6` cells.
Adding `.macrostates`
       `.macrostates_memberships`
       `.coarse_T`
       `.coarse_initial_distribution
       `.coarse_stationary_distribution`
       `.schur_vectors`
       `.schur_matrix`
       `.eigendecomposition`
    Finish (0:00:02)
Computing `8` macrostates
DEBUG: Setting the macrostates using macrostates memberships
DEBUG: Raising an exception if there are less than `6` cells.
Adding `.macrostates`
       `.macrostates_memberships`
       `.coarse_T`
       `.coarse_initial_distribution
       `.coarse_stationary_distribution`
       `.schur_vectors`
       `.schur_matrix`
       `.eigendecomposition`
    Finish (0:00:00)
Computing `7` macrostates
DEBUG: Setting the macrostates using macrostates memberships
DEBUG: Raising an exception if there are less than `6` cells.
Adding `.macrostates`
       `.macrostates_memberships`
       `.coarse_T`
       `.coarse_initial_distribution
       `.coarse_stationary_distribution`
       `.schur_vectors`
       `.schur_matrix`
       `.eigendecomposition`
    Finish (0:00:00)
Computing `6` macrostates
DEBUG: Setting the macrostates using macrostates memberships
DEBUG: Raising an exception if there are less than `6` cells.
Adding `.macrostates`
       `.macrostates_memberships`
       `.coarse_T`
       `.coarse_initial_distribution
       `.coarse_stationary_distribution`
       `.schur_vectors`
       `.schur_matrix`
       `.eigendecomposition`
    Finish (0:00:00)
Computing `5` macrostates
DEBUG: Setting the macrostates using macrostates memberships
DEBUG: Raising an exception if there are less than `6` cells.
Adding `.macrostates`
       `.macrostates_memberships`
       `.coarse_T`
       `.coarse_initial_distribution
       `.coarse_stationary_distribution`
       `.schur_vectors`
       `.schur_matrix`
       `.eigendecomposition`
    Finish (0:00:00)
Computing `4` macrostates
DEBUG: Setting the macrostates using macrostates memberships
DEBUG: Raising an exception if there are less than `6` cells.
Adding `.macrostates`
       `.macrostates_memberships`
       `.coarse_T`
       `.coarse_initial_distribution
       `.coarse_stationary_distribution`
       `.schur_vectors`
       `.schur_matrix`
       `.eigendecomposition`
    Finish (0:00:00)
Computing `3` macrostates
DEBUG: Setting the macrostates using macrostates memberships
DEBUG: Raising an exception if there are less than `6` cells.
Adding `.macrostates`
       `.macrostates_memberships`
       `.coarse_T`
       `.coarse_initial_distribution
       `.coarse_stationary_distribution`
       `.schur_vectors`
       `.schur_matrix`
       `.eigendecomposition`
    Finish (0:00:00)
Computing `2` macrostates
DEBUG: Setting the macrostates using macrostates memberships
DEBUG: Raising an exception if there are less than `6` cells.
Adding `.macrostates`
       `.macrostates_memberships`
       `.coarse_T`
       `.coarse_initial_distribution
       `.coarse_stationary_distribution`
       `.schur_vectors`
       `.schur_matrix`
       `.eigendecomposition`
    Finish (0:00:00)
For 1 macrostate, stationary distribution is computed
Computing eigendecomposition of the transition matrix
DEBUG: Computing top `20` eigenvalues of a sparse matrix
DEBUG: Sorting eigenvalues by their real part
Adding `adata.uns['eigendecomposition_fwd']`
       `.eigendecomposition`
    Finish (0:00:00)
DEBUG: Setting the macrostates using macrostates memberships
DEBUG: Raising an exception if there are less than `6` cells.
Adding `.macrostates`
       `.macrostates_memberships`
       `.coarse_T`
       `.coarse_initial_distribution
       `.coarse_stationary_distribution`
       `.schur_vectors`
       `.schur_matrix`
       `.eigendecomposition`
    Finish (0:00:00)
TSI score: 0.85
/Users/philipp/miniforge3/envs/crp-py311/lib/python3.11/site-packages/anndata/utils.py:311: UserWarning: X converted to numpy array with dtype float64
  warnings.warn(f"{name} converted to numpy array with dtype {arr.dtype}")
/Users/philipp/miniforge3/envs/crp-py311/lib/python3.11/site-packages/anndata/_core/aligned_df.py:68: ImplicitModificationWarning: Transforming to str index.
  warnings.warn("Transforming to str index.", ImplicitModificationWarning)
palette = {"CytoTRACEKernel": "#DE8F05", "Optimal identification": "#000000"}

if SAVE_FIGURES:
    save = FIG_DIR / "cytotracekernel" / f"tsi_ranking.{FIGURE_FORMAT}"
else:
    save = None

with mplscience.style_context():
    sns.set_style(style="whitegrid")
    estimator.plot_tsi(palette=palette, save=save)
    plt.show()
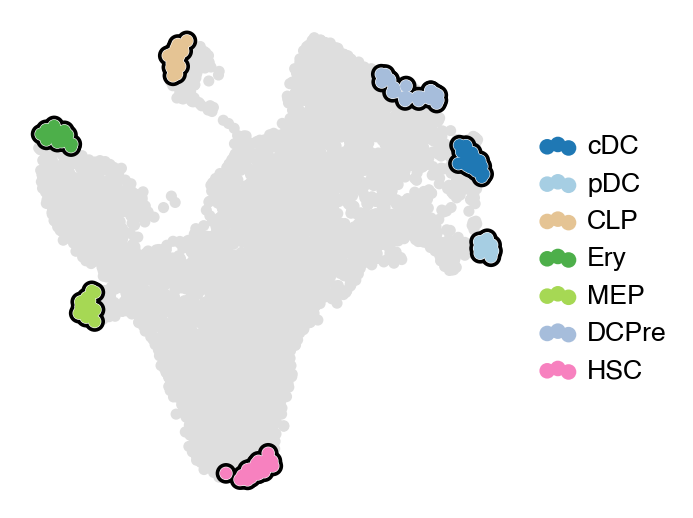
print(f"Identified macrostates: {', '.join(estimator.macrostates.cat.categories.sort_values())}")
Identified macrostates: CLP, DCPre_1, DCPre_2, Ery_1, Ery_2, Ery_3, HMP, HSC, MEP_1, MEP_2, Mono, cDC_1, cDC_2, pDC_1, pDC_2
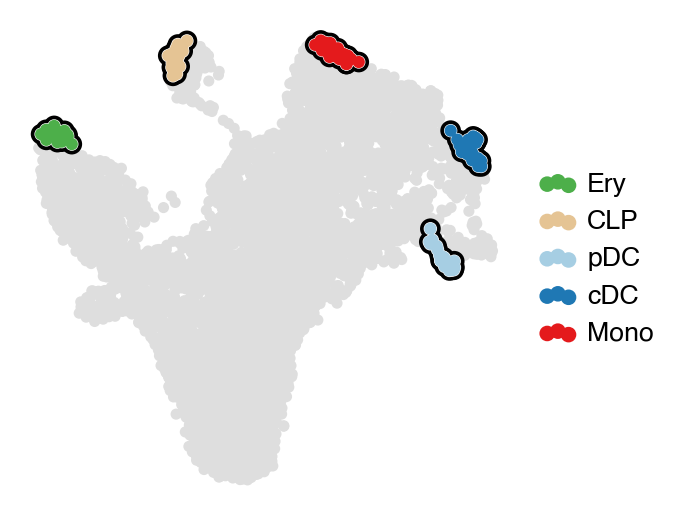
estimator.set_terminal_states(["Ery_1", "CLP", "pDC_1", "cDC_1", "Mono"])
estimator.rename_terminal_states({"Ery_1": "Ery", "pDC_1": "pDC", "cDC_1": "cDC"})

celltype_palette = dict(zip(adata.obs["celltype"].cat.categories, adata.uns["celltype_colors"]))
terminal_state_colors = [
    celltype_palette[terminal_state] for terminal_state in estimator.adata.obs["term_states_fwd"].cat.categories
]
estimator._term_states = estimator._term_states.set(colors=terminal_state_colors)

with mplscience.style_context():
    estimator.plot_macrostates(which="terminal", basis="umap", legend_loc="right", title="", size=100)

    if SAVE_FIGURES:
        fig, ax = plt.subplots(figsize=(6, 6))
        estimator.plot_macrostates(which="terminal", basis="umap", legend_loc=False, title="", size=100, ax=ax)
        fig.savefig(
            FIG_DIR / "cytotracekernel" / "terminal_states.png",
            dpi=400,
            transparent=True,
            bbox_inches="tight",
        )

    plt.show()
DEBUG: Raising an exception if there are less than `6` cells.
Adding `adata.obs['term_states_fwd']`
       `adata.obs['term_states_fwd_probs']`
       `.terminal_states`
       `.terminal_states_probabilities`
       `.terminal_states_memberships
    Finish`
/Users/philipp/miniforge3/envs/crp-py311/lib/python3.11/site-packages/scvelo/plotting/scatter.py:656: UserWarning: No data for colormapping provided via 'c'. Parameters 'cmap' will be ignored
  smp = ax.scatter(
/Users/philipp/miniforge3/envs/crp-py311/lib/python3.11/site-packages/scvelo/plotting/scatter.py:694: UserWarning: No data for colormapping provided via 'c'. Parameters 'cmap' will be ignored
  ax.scatter(
/Users/philipp/miniforge3/envs/crp-py311/lib/python3.11/site-packages/scvelo/plotting/utils.py:1396: UserWarning: No data for colormapping provided via 'c'. Parameters 'cmap' will be ignored
  ax.scatter(x, y, s=bg_size, marker=".", c=bg_color, zorder=zord - 2, **kwargs)
/Users/philipp/miniforge3/envs/crp-py311/lib/python3.11/site-packages/scvelo/plotting/utils.py:1397: UserWarning: No data for colormapping provided via 'c'. Parameters 'cmap' will be ignored
  ax.scatter(x, y, s=gp_size, marker=".", c=gp_color, zorder=zord - 1, **kwargs)
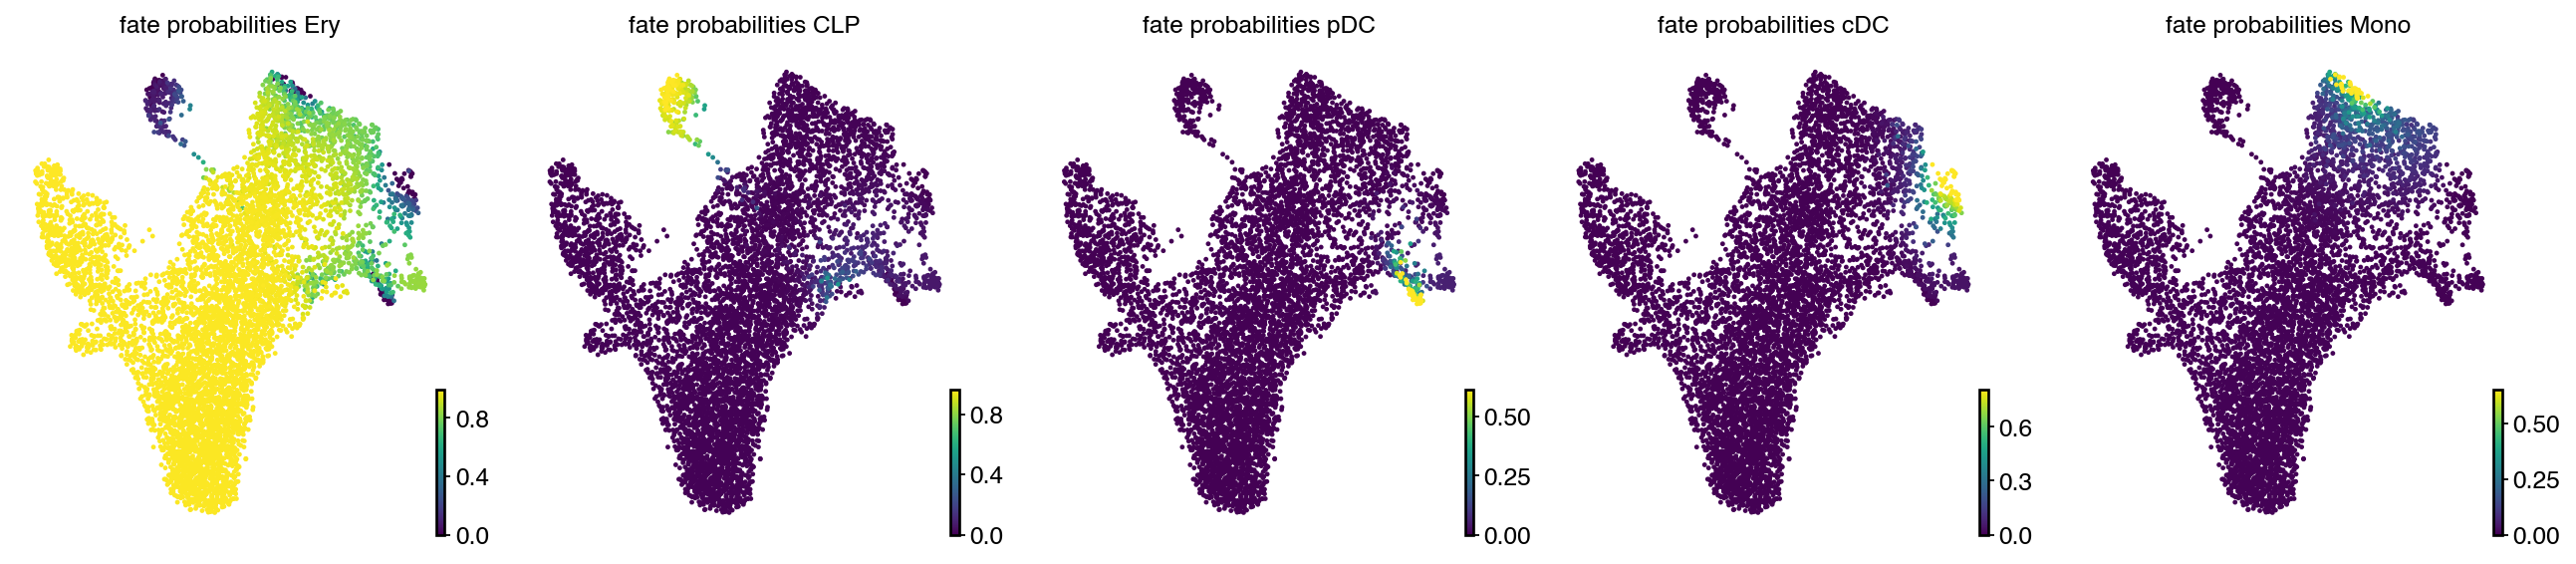
estimator.compute_fate_probabilities()
with mplscience.style_context():
    estimator.plot_fate_probabilities(same_plot=False, basis="umap", ncols=5)
    plt.show()

if SAVE_FIGURES:
    bdata = adata.copy()
    bdata.obs[estimator.fate_probabilities.names.tolist()] = estimator.fate_probabilities.X

    for lineage in estimator.fate_probabilities.names.tolist():
        with mplscience.style_context():
            fig, ax = plt.subplots(figsize=(6, 6))
            scv.pl.scatter(bdata, basis="umap", color=lineage, cmap="viridis", title="", colorbar=False, ax=ax)
            fig.savefig(
                FIG_DIR / "cytotracekernel" / f"{lineage.lower()}_fate_terminal_set.png",
                dpi=400,
                transparent=True,
                bbox_inches="tight",
            )
            plt.show()
    del bdata
Computing fate probabilities
DEBUG: Solving the linear system using `PETSc` solver `'gmres'` on `1` core(s) with no preconditioner and `tol=1e-06`
Adding `adata.obsm['lineages_fwd']`
       `.fate_probabilities`
    Finish (0:00:00)
cluster_key = "celltype"
rep = "X_pca"

cbc = []
for source, target in tqdm(STATE_TRANSITIONS):
    _cbc = ctk.cbc(source=source, target=target, cluster_key=cluster_key, rep=rep)

    cbc.append(
        pd.DataFrame(
            {
                "state_transition": [f"{source} - {target}"] * len(_cbc),
                "cbc": _cbc,
            }
        )
    )
cbc = pd.concat(cbc)

if SAVE_RESULTS:
    cbc.to_parquet(DATA_DIR / "bone_marrow" / "results" / "ct_cbc.parquet")

cbc.head()
100%|██████████| 8/8 [00:00<00:00, 13.31it/s]
| state_transition | cbc | |
|---|---|---|
| 0 | HSC - MEP | 0.799256 |
| 1 | HSC - MEP | 0.572809 |
| 2 | HSC - MEP | 0.702549 |
| 3 | HSC - MEP | 0.409971 |
| 4 | HSC - MEP | 0.866234 |