Human hematopoiesis analysis with the PseudotimeKernel#
In this analysis, we recapitulate human bone marrow development with the PseudotimeKernel, relying on pseudotime
estimates computed with Palantir. To run the analysis, ensure that the processed data is either already saved, or
generate it using the corresponding notebook preprocessing.ipynb.
The corresponding data can be generated through the preprocessing notebooks pseudotime/preprocessing.ipynb, or
downloaded driectly from here and should be
saved in data/bone_marrow/processed/adata.h5ad, i.e.,
mkdir -p ../../data/bone_marrow/processed/
wget https://figshare.com/ndownloader/files/53394941 -O ../../data/bone_marrow/processed/adata.h5ad
Library imports#
import warnings

from tqdm import tqdm

import numpy as np
import pandas as pd
from scipy.stats import ttest_ind

import matplotlib as mpl
import matplotlib.pyplot as plt
import mplscience
import seaborn as sns
from matplotlib.patches import Patch

import anndata as ad
import cellrank as cr
import scanpy as sc
import scvelo as scv

from crp import DATA_DIR, FIG_DIR
from crp.core import G2M_GENES, S_GENES
from crp.plotting import plot_tsi
General settings#
warnings.filterwarnings(action="ignore", category=FutureWarning)
sc.settings.verbosity = 2
cr.settings.verbosity = 4
scv.settings.verbosity = 3
mpl.use("module://matplotlib_inline.backend_inline")
mpl.rcParams["backend"]

plt.rcParams["font.family"] = "sans-serif"
plt.rcParams["font.sans-serif"] = ["Arial"]
scv.settings.set_figure_params("scvelo", dpi_save=400, dpi=80, transparent=True, fontsize=20, color_map="viridis")
Constants#
SAVE_FIGURES = False
if SAVE_FIGURES:
    (FIG_DIR / "pseudotimekernel").mkdir(parents=True, exist_ok=True)

FIGURE_FORMAT = "svg"
SAVE_RESULTS = True
if SAVE_RESULTS:
    (DATA_DIR / "bone_marrow" / "results").mkdir(parents=True, exist_ok=True)
TERMINAL_STATES = ["Ery", "CLP", "cDC", "pDC", "Mono"]
STATE_TRANSITIONS = [
    ("HSC", "MEP"),
    ("MEP", "Ery"),
    ("HSC", "HMP"),
    ("HMP", "Mono"),
    ("HMP", "CLP"),
    ("HMP", "DCPre"),
    ("DCPre", "pDC"),
    ("DCPre", "cDC"),
]
SIGNIFICANCE_PALETTE = {"n.s.": "#dedede", "*": "#90BAAD", "**": "#A1E5AB", "***": "#ADF6B1"}
Function definitions#
def get_significance(pvalue) -> str:
    """Assign significance symbol based on p-value."""
    if pvalue < 0.001:
        return "***"
    elif pvalue < 0.01:
        return "**"
    elif pvalue < 0.1:
        return "*"
    else:
        return "n.s."
def get_ttest_res(cbc: pd.DataFrame):
    """Perform t tests to assess CBC difference."""
    ttest_res = {}
    significances = {}

    for source, target in STATE_TRANSITIONS:
        obs_mask = cbc["State transition"].isin([f"{source} - {target}"])
        a = cbc.loc[obs_mask, "Log ratio"].values
        b = np.zeros(len(a))

        ttest_res[f"{source} - {target}"] = ttest_ind(a, b, equal_var=False, alternative="greater")
        significances[f"{source} - {target}"] = get_significance(ttest_res[f"{source} - {target}"].pvalue)

    return ttest_res, significances
def get_palette(significances: dict[str, float]) -> dict[str, str]:
    """Generate a color palette for statistical significance."""
    palette = {
        state_transition: SIGNIFICANCE_PALETTE[significance] for state_transition, significance in significances.items()
    }
    return palette
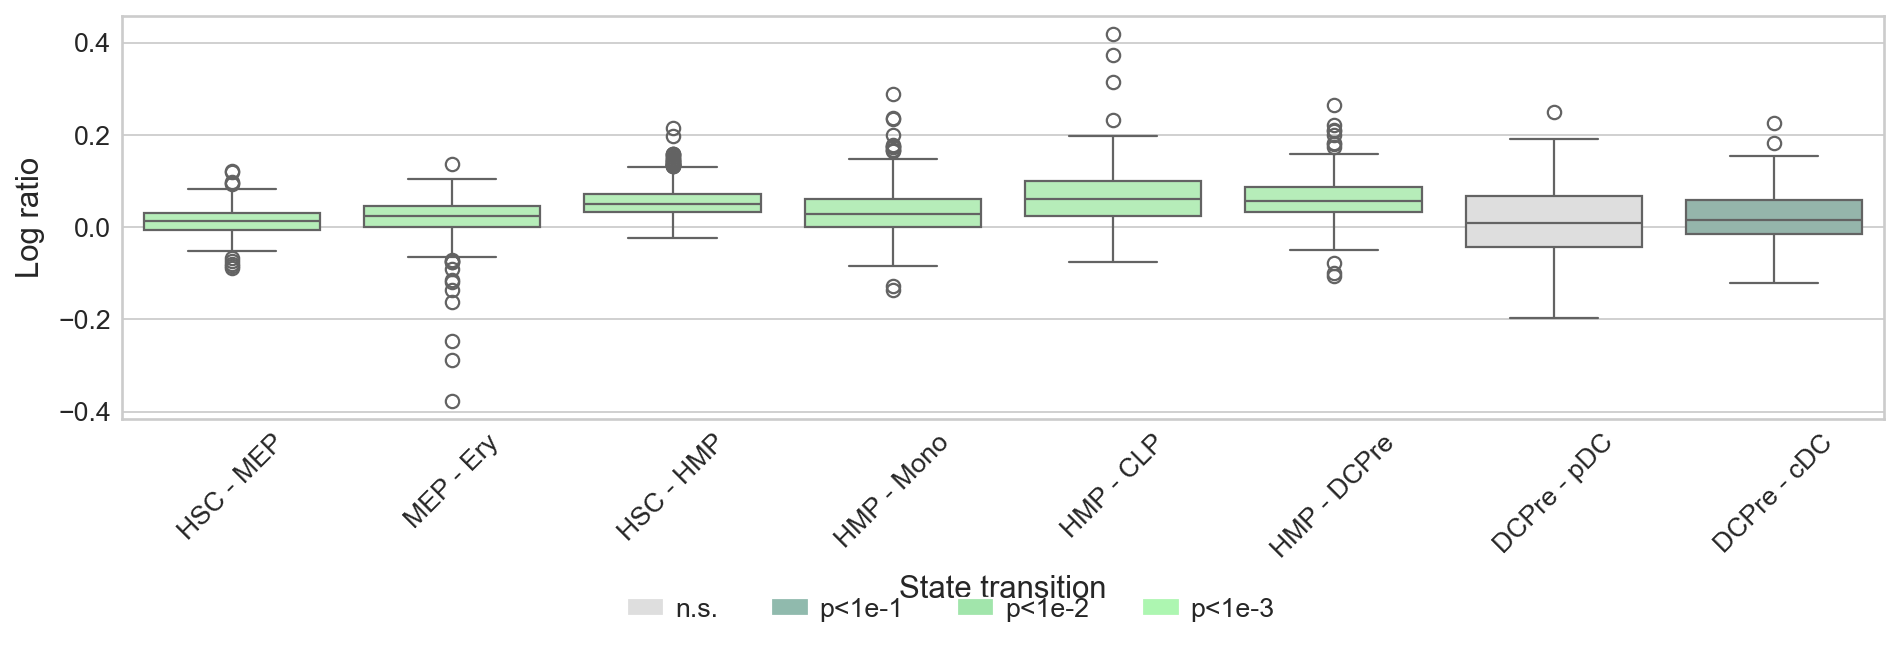
def plot_cbc_ratio(cbc: pd.DataFrame, palette: dict, figsize=(12, 6), fpath: None | str = None) -> None:
    """Plot the CBC ratio, colored by significance, to compare kernel performance."""
    with mplscience.style_context():
        sns.set_style(style="whitegrid")
        fig, ax = plt.subplots(figsize=figsize)

        sns.boxplot(data=cbc, x="State transition", y="Log ratio", palette=palette, ax=ax)

        ax.tick_params(axis="x", rotation=45)

        handles = [Patch(label=label, facecolor=color) for label, color in SIGNIFICANCE_PALETTE.items()]
        fig.legend(
            handles=handles,
            labels=["n.s.", "p<1e-1", "p<1e-2", "p<1e-3"],
            loc="lower center",
            ncol=4,
            bbox_to_anchor=(0.5, -0.025),
        )
        fig.tight_layout()
        plt.show()

        if fpath is not None:
            fig.savefig(fpath, format="svg", transparent=True, bbox_inches="tight")
Data loading#
adata = ad.io.read_h5ad(DATA_DIR / "bone_marrow" / "processed" / "adata.h5ad")
adata
AnnData object with n_obs × n_vars = 6881 × 1500
    obs: 'leiden', 'celltype', 'n_counts', 'palantir_pseudotime'
    var: 'highly_variable', 'means', 'dispersions', 'dispersions_norm'
    uns: 'celltype_colors', 'hvg', 'log1p', 'neighbors', 'pca', 'umap'
    obsm: 'X_diffmap', 'X_pca', 'X_umap'
    varm: 'PCs'
    layers: 'MAGIC_imputed_data'
    obsp: 'connectivities', 'distances'
PseudotimeKernel#
Kernel#
ptk = cr.kernels.PseudotimeKernel(adata, time_key="palantir_pseudotime")
ptk.compute_transition_matrix(threshold_scheme="soft")
Computing transition matrix based on pseudotime
Finish (0:00:00)
PseudotimeKernel[n=6881, dnorm=False, scheme='soft', b=10.0, nu=0.5]
with mplscience.style_context():
if SAVE_FIGURES:
dpi = 400
save = FIG_DIR / "pseudotimekernel" / "umap_rws.png"
else:
dpi = 150
save = None
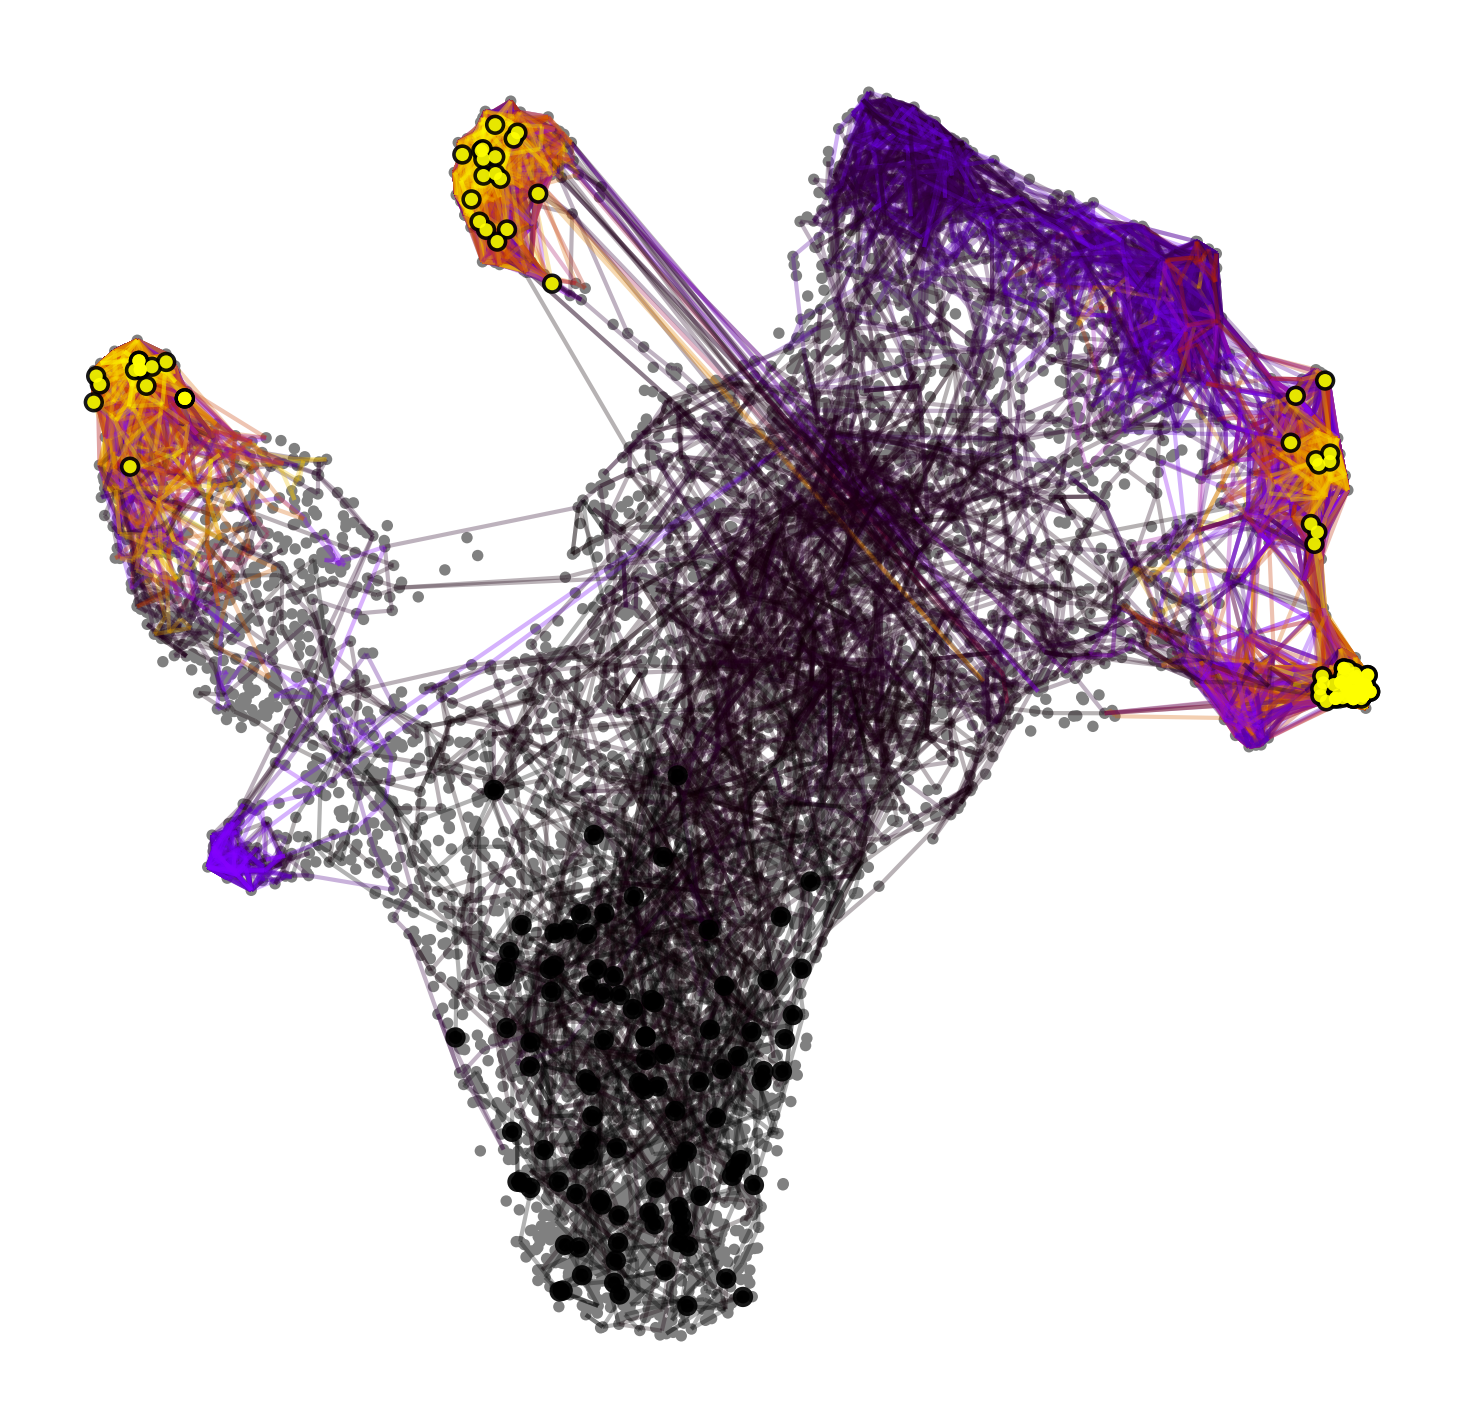
ptk.plot_random_walks(
start_ixs={"celltype": "HSC"}, basis="umap", seed=0, dpi=dpi, size=30, save=save, figsize=(6, 6)
)
plt.show()
Simulating `100` random walks of maximum length `1721`
    Finish (0:00:08)
Plotting random walks
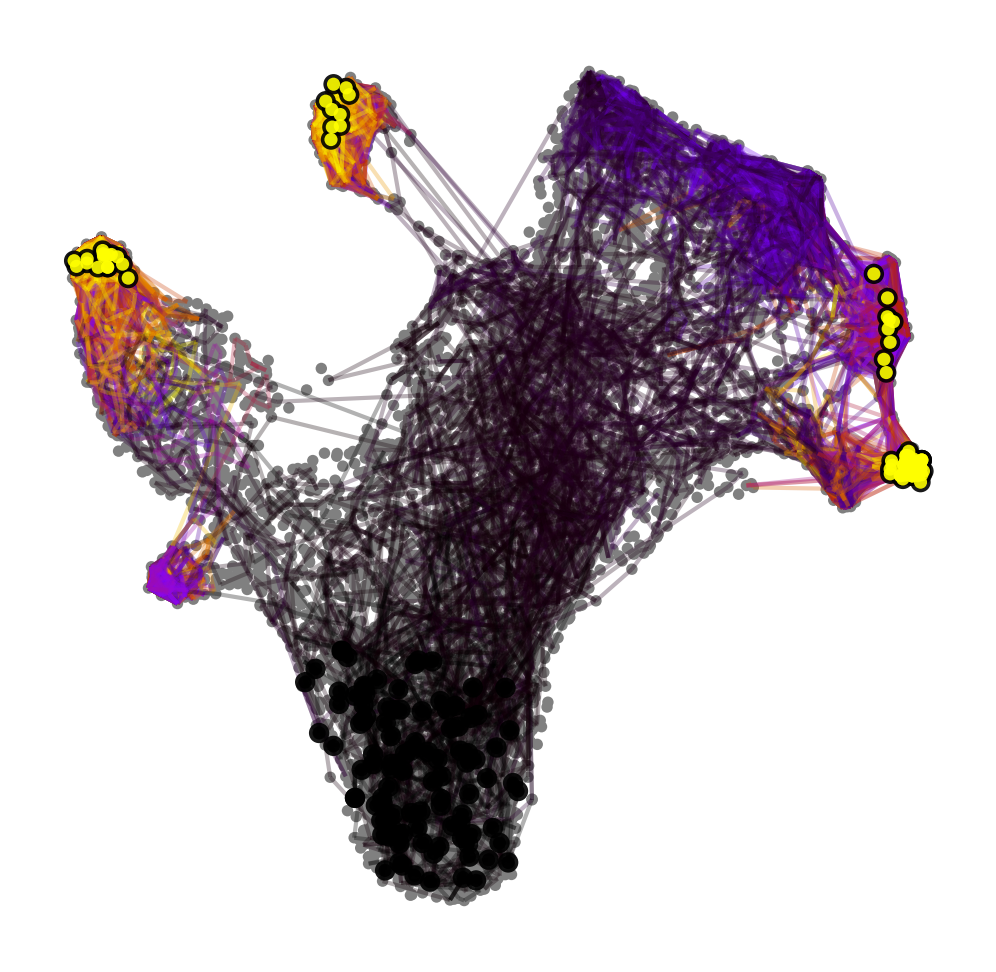
with mplscience.style_context():
    ptk.plot_random_walks(start_ixs={"palantir_pseudotime": [0, 0.1]}, basis="umap", seed=0, dpi=150, size=30)
    plt.show()
Simulating `100` random walks of maximum length `1721`
    Finish (0:00:08)
Plotting random walks
Estimator#
estimator = cr.estimators.GPCCA(ptk)
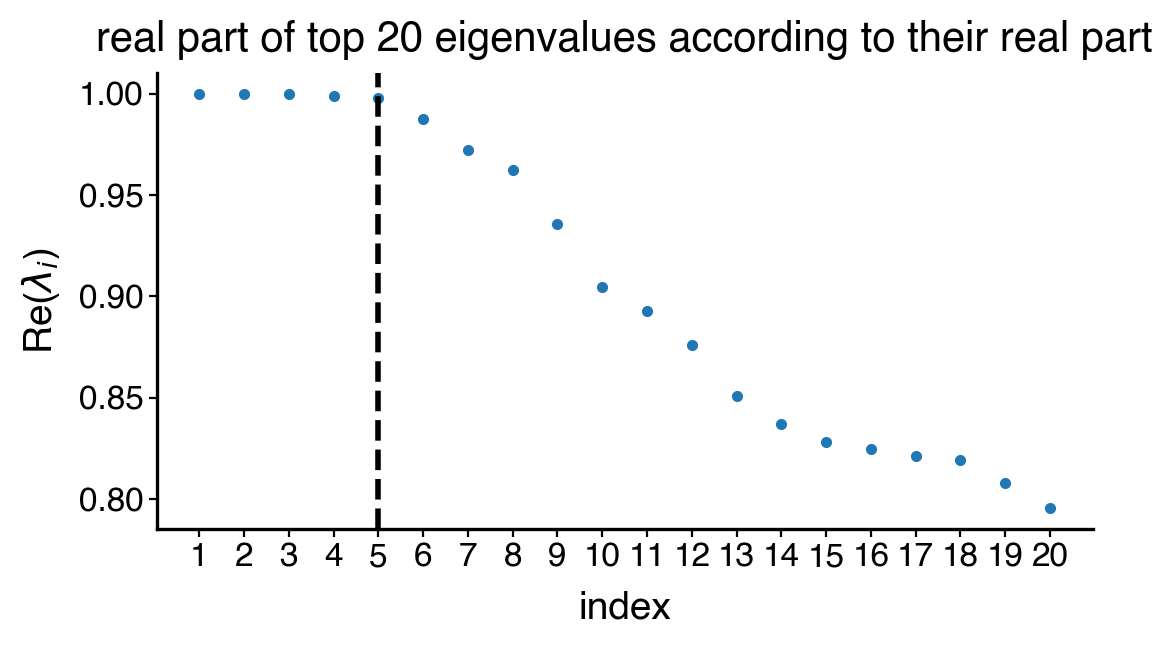
estimator.compute_schur()
with mplscience.style_context():
if SAVE_FIGURES:
save = FIG_DIR / "pseudotimekernel" / f"spectrum.{FIGURE_FORMAT}"
else:
save = False
estimator.plot_spectrum(real_only=True, figsize=(6, 3), save=save)
plt.show()
Computing Schur decomposition
Adding `adata.uns['eigendecomposition_fwd']`
       `.schur_vectors`
       `.schur_matrix`
       `.eigendecomposition`
    Finish (0:00:03)
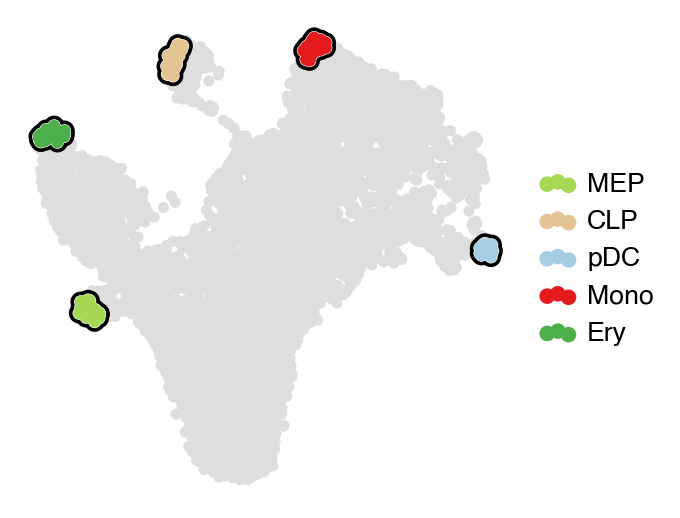
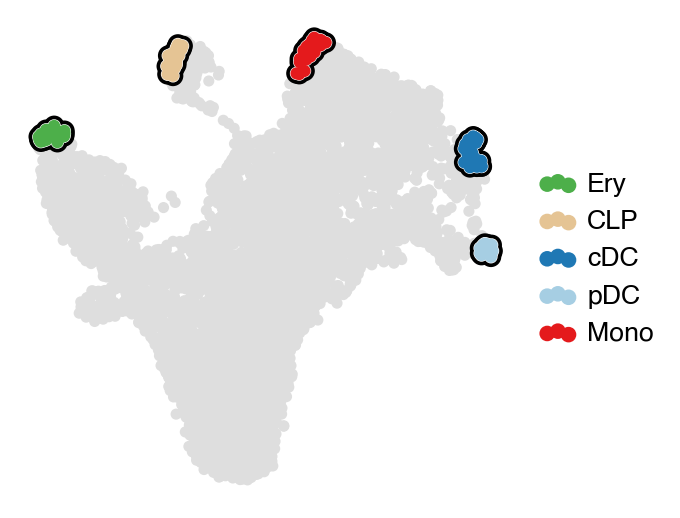
estimator.compute_macrostates(5, cluster_key="celltype")

with mplscience.style_context():
    estimator.plot_macrostates(which="all", basis="umap", legend_loc="right", title="", size=100)
    if SAVE_FIGURES:
        fig, ax = plt.subplots(figsize=(6, 6))
        estimator.plot_macrostates(which="all", basis="umap", legend_loc=False, title="", size=100, ax=ax)
        fig.savefig(
            FIG_DIR / "pseudotimekernel" / "5_macrostates.png",
            dpi=400,
            transparent=True,
            bbox_inches="tight",
        )
    plt.show()
Computing `5` macrostates
DEBUG: Setting the macrostates using macrostates memberships
DEBUG: Raising an exception if there are less than `6` cells.
Adding `.macrostates`
       `.macrostates_memberships`
       `.coarse_T`
       `.coarse_initial_distribution
       `.coarse_stationary_distribution`
       `.schur_vectors`
       `.schur_matrix`
       `.eigendecomposition`
    Finish (0:00:00)
/Users/philipp/miniforge3/envs/crp-py311/lib/python3.11/site-packages/scvelo/plotting/scatter.py:656: UserWarning: No data for colormapping provided via 'c'. Parameters 'cmap' will be ignored
  smp = ax.scatter(
/Users/philipp/miniforge3/envs/crp-py311/lib/python3.11/site-packages/scvelo/plotting/scatter.py:694: UserWarning: No data for colormapping provided via 'c'. Parameters 'cmap' will be ignored
  ax.scatter(
/Users/philipp/miniforge3/envs/crp-py311/lib/python3.11/site-packages/scvelo/plotting/utils.py:1396: UserWarning: No data for colormapping provided via 'c'. Parameters 'cmap' will be ignored
  ax.scatter(x, y, s=bg_size, marker=".", c=bg_color, zorder=zord - 2, **kwargs)
/Users/philipp/miniforge3/envs/crp-py311/lib/python3.11/site-packages/scvelo/plotting/utils.py:1397: UserWarning: No data for colormapping provided via 'c'. Parameters 'cmap' will be ignored
  ax.scatter(x, y, s=gp_size, marker=".", c=gp_color, zorder=zord - 1, **kwargs)
cluster_key = "celltype"
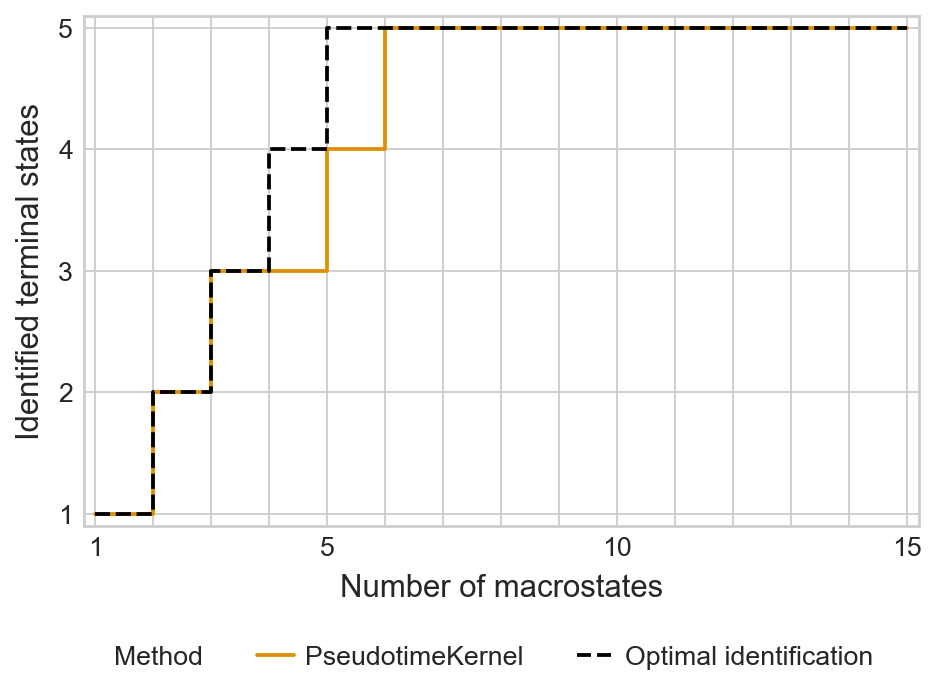
tsi_score = estimator.tsi(n_macrostates=15, terminal_states=TERMINAL_STATES, cluster_key=cluster_key)
print(f"TSI score: {tsi_score:.2f}")
Computing `15` macrostates
DEBUG: Setting the macrostates using macrostates memberships
DEBUG: Raising an exception if there are less than `6` cells.
Adding `.macrostates`
       `.macrostates_memberships`
       `.coarse_T`
       `.coarse_initial_distribution
       `.coarse_stationary_distribution`
       `.schur_vectors`
       `.schur_matrix`
       `.eigendecomposition`
    Finish (0:00:21)
Computing `14` macrostates
DEBUG: Setting the macrostates using macrostates memberships
DEBUG: Raising an exception if there are less than `6` cells.
Adding `.macrostates`
       `.macrostates_memberships`
       `.coarse_T`
       `.coarse_initial_distribution
       `.coarse_stationary_distribution`
       `.schur_vectors`
       `.schur_matrix`
       `.eigendecomposition`
    Finish (0:00:14)
Computing `13` macrostates
DEBUG: Setting the macrostates using macrostates memberships
DEBUG: Raising an exception if there are less than `6` cells.
Adding `.macrostates`
       `.macrostates_memberships`
       `.coarse_T`
       `.coarse_initial_distribution
       `.coarse_stationary_distribution`
       `.schur_vectors`
       `.schur_matrix`
       `.eigendecomposition`
    Finish (0:00:07)
Computing `12` macrostates
DEBUG: Setting the macrostates using macrostates memberships
DEBUG: Raising an exception if there are less than `6` cells.
Adding `.macrostates`
       `.macrostates_memberships`
       `.coarse_T`
       `.coarse_initial_distribution
       `.coarse_stationary_distribution`
       `.schur_vectors`
       `.schur_matrix`
       `.eigendecomposition`
    Finish (0:00:03)
Computing `11` macrostates
DEBUG: Setting the macrostates using macrostates memberships
DEBUG: Raising an exception if there are less than `6` cells.
Adding `.macrostates`
       `.macrostates_memberships`
       `.coarse_T`
       `.coarse_initial_distribution
       `.coarse_stationary_distribution`
       `.schur_vectors`
       `.schur_matrix`
       `.eigendecomposition`
    Finish (0:00:03)
Computing `10` macrostates
DEBUG: Setting the macrostates using macrostates memberships
DEBUG: Raising an exception if there are less than `6` cells.
Adding `.macrostates`
       `.macrostates_memberships`
       `.coarse_T`
       `.coarse_initial_distribution
       `.coarse_stationary_distribution`
       `.schur_vectors`
       `.schur_matrix`
       `.eigendecomposition`
    Finish (0:00:03)
Computing `9` macrostates
DEBUG: Setting the macrostates using macrostates memberships
DEBUG: Raising an exception if there are less than `6` cells.
Adding `.macrostates`
       `.macrostates_memberships`
       `.coarse_T`
       `.coarse_initial_distribution
       `.coarse_stationary_distribution`
       `.schur_vectors`
       `.schur_matrix`
       `.eigendecomposition`
    Finish (0:00:01)
Computing `8` macrostates
DEBUG: Setting the macrostates using macrostates memberships
DEBUG: Raising an exception if there are less than `6` cells.
Adding `.macrostates`
       `.macrostates_memberships`
       `.coarse_T`
       `.coarse_initial_distribution
       `.coarse_stationary_distribution`
       `.schur_vectors`
       `.schur_matrix`
       `.eigendecomposition`
    Finish (0:00:01)
Computing `7` macrostates
DEBUG: Setting the macrostates using macrostates memberships
DEBUG: Raising an exception if there are less than `6` cells.
Adding `.macrostates`
       `.macrostates_memberships`
       `.coarse_T`
       `.coarse_initial_distribution
       `.coarse_stationary_distribution`
       `.schur_vectors`
       `.schur_matrix`
       `.eigendecomposition`
    Finish (0:00:00)
Computing `6` macrostates
DEBUG: Setting the macrostates using macrostates memberships
DEBUG: Raising an exception if there are less than `6` cells.
Adding `.macrostates`
       `.macrostates_memberships`
       `.coarse_T`
       `.coarse_initial_distribution
       `.coarse_stationary_distribution`
       `.schur_vectors`
       `.schur_matrix`
       `.eigendecomposition`
    Finish (0:00:00)
Computing `5` macrostates
DEBUG: Setting the macrostates using macrostates memberships
DEBUG: Raising an exception if there are less than `6` cells.
Adding `.macrostates`
       `.macrostates_memberships`
       `.coarse_T`
       `.coarse_initial_distribution
       `.coarse_stationary_distribution`
       `.schur_vectors`
       `.schur_matrix`
       `.eigendecomposition`
    Finish (0:00:00)
Computing `4` macrostates
DEBUG: Setting the macrostates using macrostates memberships
DEBUG: Raising an exception if there are less than `6` cells.
Adding `.macrostates`
       `.macrostates_memberships`
       `.coarse_T`
       `.coarse_initial_distribution
       `.coarse_stationary_distribution`
       `.schur_vectors`
       `.schur_matrix`
       `.eigendecomposition`
    Finish (0:00:00)
Computing `3` macrostates
DEBUG: Setting the macrostates using macrostates memberships
DEBUG: Raising an exception if there are less than `6` cells.
Adding `.macrostates`
       `.macrostates_memberships`
       `.coarse_T`
       `.coarse_initial_distribution
       `.coarse_stationary_distribution`
       `.schur_vectors`
       `.schur_matrix`
       `.eigendecomposition`
    Finish (0:00:00)
Computing `2` macrostates
DEBUG: Setting the macrostates using macrostates memberships
DEBUG: Raising an exception if there are less than `6` cells.
Adding `.macrostates`
       `.macrostates_memberships`
       `.coarse_T`
       `.coarse_initial_distribution
       `.coarse_stationary_distribution`
       `.schur_vectors`
       `.schur_matrix`
       `.eigendecomposition`
    Finish (0:00:00)
For 1 macrostate, stationary distribution is computed
Computing eigendecomposition of the transition matrix
DEBUG: Computing top `20` eigenvalues of a sparse matrix
DEBUG: Sorting eigenvalues by their real part
Adding `adata.uns['eigendecomposition_fwd']`
       `.eigendecomposition`
    Finish (0:00:00)
DEBUG: Setting the macrostates using macrostates memberships
DEBUG: Raising an exception if there are less than `6` cells.
Adding `.macrostates`
       `.macrostates_memberships`
       `.coarse_T`
       `.coarse_initial_distribution
       `.coarse_stationary_distribution`
       `.schur_vectors`
       `.schur_matrix`
       `.eigendecomposition`
    Finish (0:00:00)
TSI score: 0.97
/Users/philipp/miniforge3/envs/crp-py311/lib/python3.11/site-packages/anndata/_core/aligned_df.py:68: ImplicitModificationWarning: Transforming to str index.
  warnings.warn("Transforming to str index.", ImplicitModificationWarning)
palette = {"PseudotimeKernel": "#DE8F05", "Optimal identification": "#000000"}

with mplscience.style_context():
    sns.set_style(style="whitegrid")
    estimator.plot_tsi(palette=palette)
    plt.show()
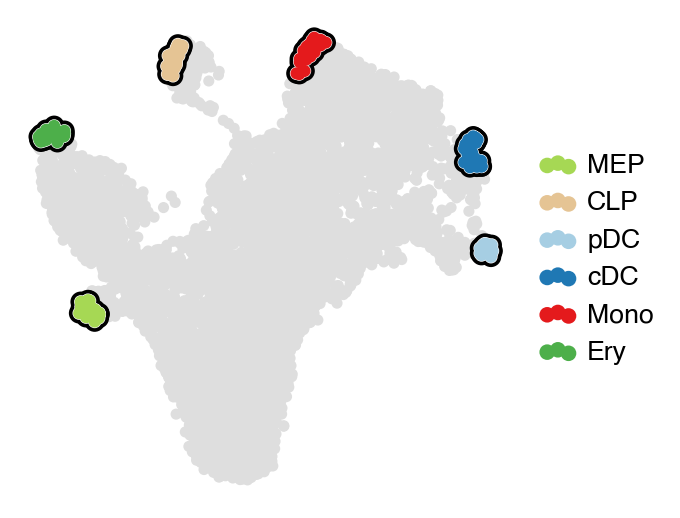
estimator.compute_macrostates(6, cluster_key="celltype")

with mplscience.style_context():
    estimator.plot_macrostates(which="all", basis="umap", legend_loc="right", title="", size=100)
    if SAVE_FIGURES:
        fig, ax = plt.subplots(figsize=(6, 6))
        estimator.plot_macrostates(which="all", basis="umap", legend_loc=False, title="", size=100, ax=ax)
        fig.savefig(
            FIG_DIR / "pseudotimekernel" / "6_macrostates.png",
            dpi=400,
            transparent=True,
            bbox_inches="tight",
        )
    plt.show()
Computing `6` macrostates
DEBUG: Setting the macrostates using macrostates memberships
DEBUG: Raising an exception if there are less than `6` cells.
Adding `.macrostates`
       `.macrostates_memberships`
       `.coarse_T`
       `.coarse_initial_distribution
       `.coarse_stationary_distribution`
       `.schur_vectors`
       `.schur_matrix`
       `.eigendecomposition`
    Finish (0:00:00)
/Users/philipp/miniforge3/envs/crp-py311/lib/python3.11/site-packages/scvelo/plotting/scatter.py:656: UserWarning: No data for colormapping provided via 'c'. Parameters 'cmap' will be ignored
  smp = ax.scatter(
/Users/philipp/miniforge3/envs/crp-py311/lib/python3.11/site-packages/scvelo/plotting/scatter.py:694: UserWarning: No data for colormapping provided via 'c'. Parameters 'cmap' will be ignored
  ax.scatter(
/Users/philipp/miniforge3/envs/crp-py311/lib/python3.11/site-packages/scvelo/plotting/utils.py:1396: UserWarning: No data for colormapping provided via 'c'. Parameters 'cmap' will be ignored
  ax.scatter(x, y, s=bg_size, marker=".", c=bg_color, zorder=zord - 2, **kwargs)
/Users/philipp/miniforge3/envs/crp-py311/lib/python3.11/site-packages/scvelo/plotting/utils.py:1397: UserWarning: No data for colormapping provided via 'c'. Parameters 'cmap' will be ignored
  ax.scatter(x, y, s=gp_size, marker=".", c=gp_color, zorder=zord - 1, **kwargs)
estimator.predict_terminal_states()
# estimator.set_terminal_states(TERMINAL_STATES)

with mplscience.style_context():
    estimator.plot_macrostates(which="terminal", basis="umap", legend_loc="right", title="", size=100)

    if SAVE_FIGURES:
        fig, ax = plt.subplots(figsize=(6, 6))
        estimator.plot_macrostates(which="terminal", basis="umap", legend_loc=False, title="", size=100, ax=ax)
        fig.savefig(
            FIG_DIR / "pseudotimekernel" / "terminal_states_inferred.png",
            dpi=400,
            transparent=True,
            bbox_inches="tight",
        )

    plt.show()
DEBUG: Raising an exception if there are less than `6` cells.
Adding `adata.obs['term_states_fwd']`
       `adata.obs['term_states_fwd_probs']`
       `.terminal_states`
       `.terminal_states_probabilities`
       `.terminal_states_memberships
    Finish`
/Users/philipp/miniforge3/envs/crp-py311/lib/python3.11/site-packages/scvelo/plotting/scatter.py:656: UserWarning: No data for colormapping provided via 'c'. Parameters 'cmap' will be ignored
  smp = ax.scatter(
/Users/philipp/miniforge3/envs/crp-py311/lib/python3.11/site-packages/scvelo/plotting/scatter.py:694: UserWarning: No data for colormapping provided via 'c'. Parameters 'cmap' will be ignored
  ax.scatter(
/Users/philipp/miniforge3/envs/crp-py311/lib/python3.11/site-packages/scvelo/plotting/utils.py:1396: UserWarning: No data for colormapping provided via 'c'. Parameters 'cmap' will be ignored
  ax.scatter(x, y, s=bg_size, marker=".", c=bg_color, zorder=zord - 2, **kwargs)
/Users/philipp/miniforge3/envs/crp-py311/lib/python3.11/site-packages/scvelo/plotting/utils.py:1397: UserWarning: No data for colormapping provided via 'c'. Parameters 'cmap' will be ignored
  ax.scatter(x, y, s=gp_size, marker=".", c=gp_color, zorder=zord - 1, **kwargs)
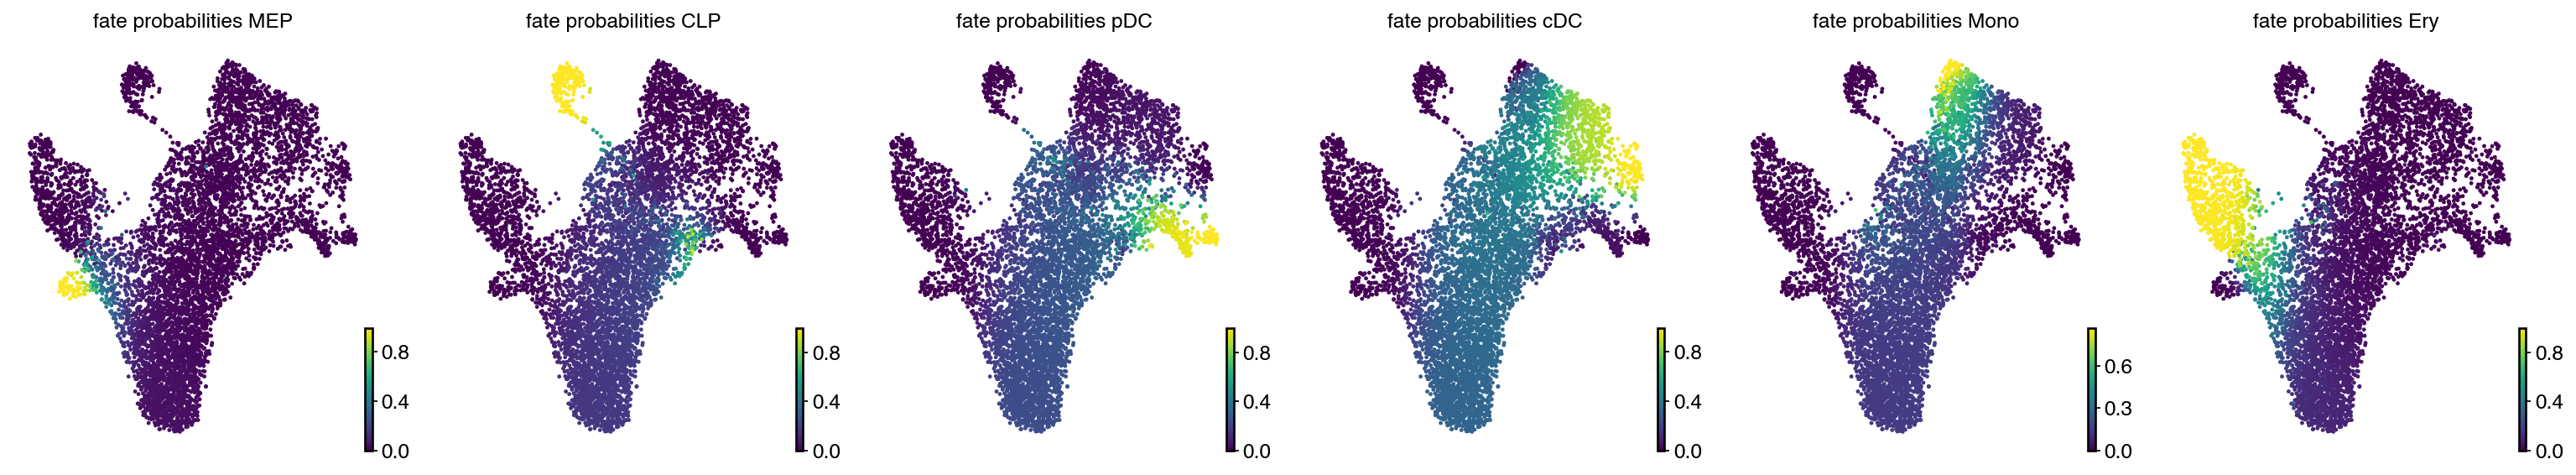
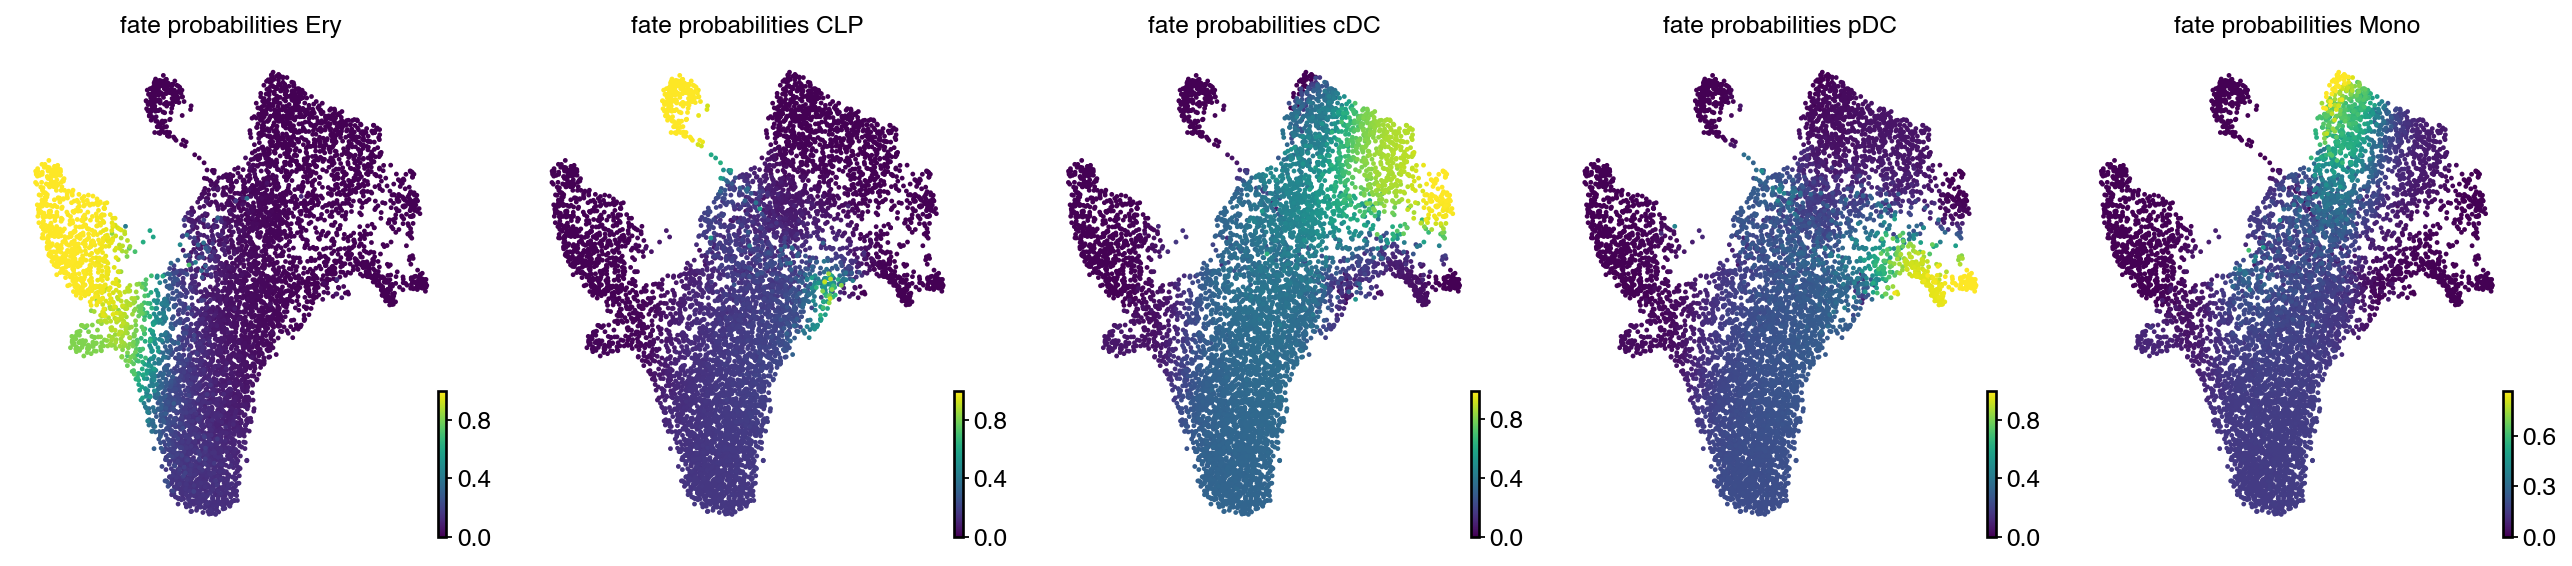
estimator.compute_fate_probabilities()
with mplscience.style_context():
    estimator.plot_fate_probabilities(same_plot=False, basis="umap", ncols=6)
    plt.show()

if SAVE_FIGURES:
    bdata = adata.copy()
    bdata.obs[estimator.fate_probabilities.names.tolist()] = estimator.fate_probabilities.X

    for lineage in estimator.fate_probabilities.names.tolist():
        with mplscience.style_context():
            fig, ax = plt.subplots(figsize=(6, 6))
            scv.pl.scatter(bdata, basis="umap", color=lineage, cmap="viridis", title="", colorbar=False, ax=ax)
            fig.savefig(
                FIG_DIR / "pseudotimekernel" / f"{lineage.lower()}_fate_terminal_pred.png",
                dpi=400,
                transparent=True,
                bbox_inches="tight",
            )
            plt.show()
    del bdata
Computing fate probabilities
DEBUG: Solving the linear system using `PETSc` solver `'gmres'` on `1` core(s) with no preconditioner and `tol=1e-06`
Adding `adata.obsm['lineages_fwd']`
       `.fate_probabilities`
    Finish (0:00:00)
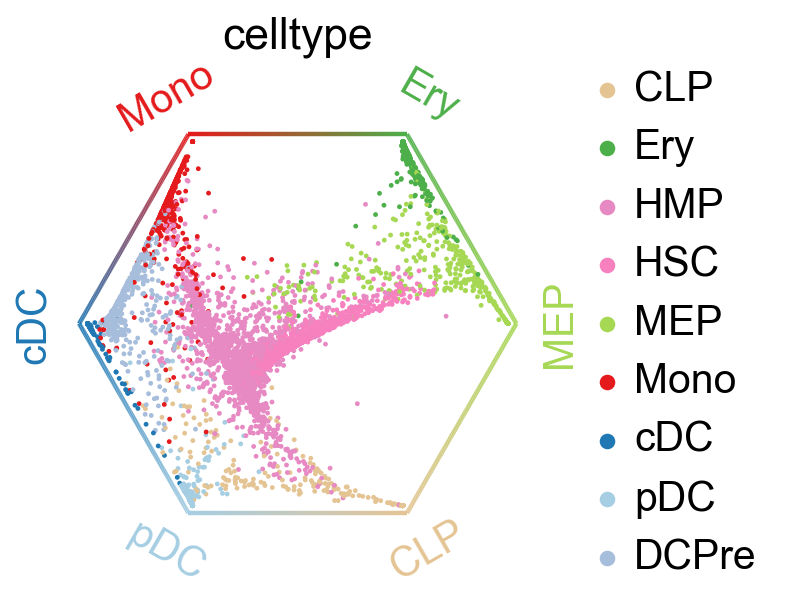
if SAVE_FIGURES:
    save = FIG_DIR / "pseudotimekernel" / f"circular_projection.{FIGURE_FORMAT}"
else:
    save = None

cr.pl.circular_projection(adata, keys=cluster_key, legend_loc="right", save=save)
DEBUG: Set ordering to `optimal`
Solving TSP for `6` states
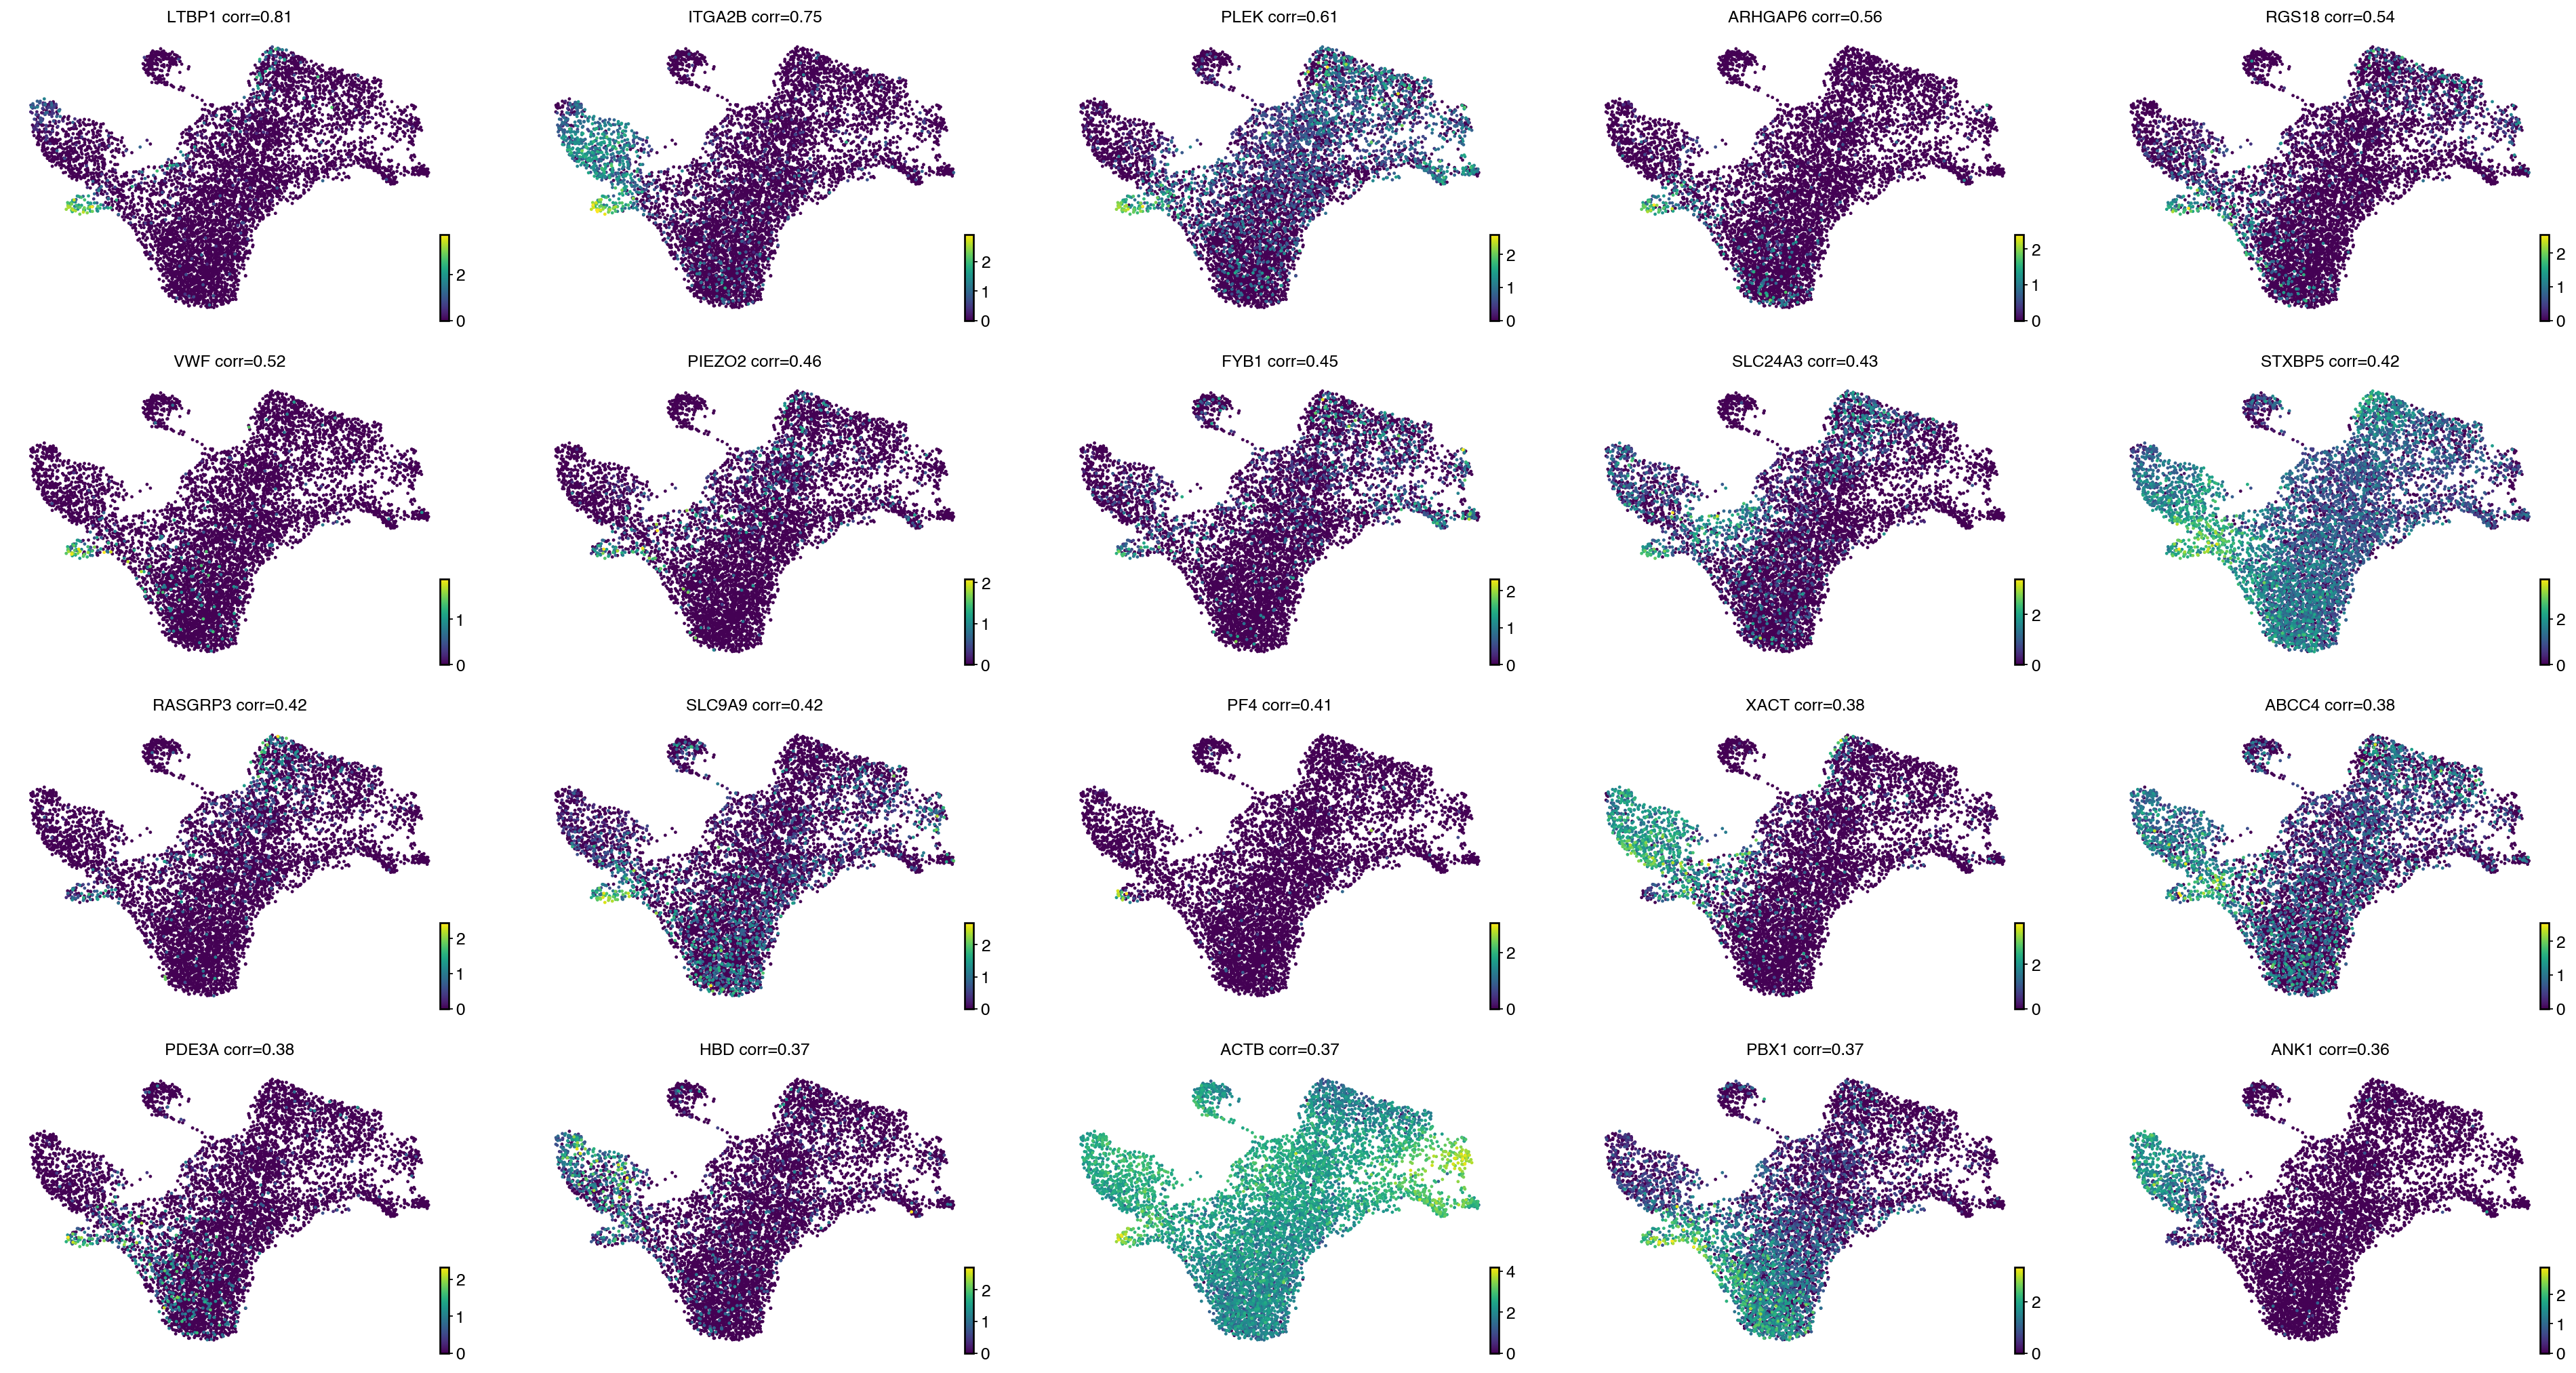
drivers = estimator.compute_lineage_drivers(
    return_drivers=True, cluster_key="celltype", lineages=["MEP"], clusters=["HSC", "MEP"]
)

with mplscience.style_context():
    estimator.plot_lineage_drivers(lineage="MEP", n_genes=20, ncols=5, title_fmt="{gene} corr={corr:.2}")
    plt.show()
DEBUG: Computing correlations for lineages `['MEP']` restricted to clusters `['HSC', 'MEP']` in layer `X` with `use_raw=False`
Adding `adata.varm['terminal_lineage_drivers']`
       `.lineage_drivers`
    Finish (0:00:00)
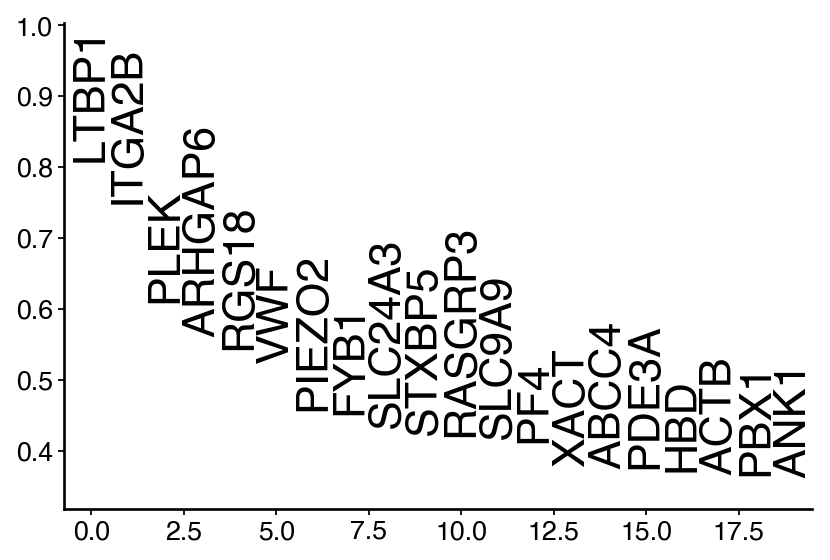
gene_names = drivers.loc[
    ~(drivers.index.str.startswith(("MT.", "RPL", "RPS", "^HB[^(p)]")) | drivers.index.isin(S_GENES + G2M_GENES)),
    :,
].index

ranking = pd.DataFrame(drivers.loc[gene_names, "MEP_corr"])
ranking["ranking"] = np.arange(len(gene_names))
df = ranking.iloc[:20, :]

with mplscience.style_context():
    fig, ax = plt.subplots(figsize=(6, 4))
    y_min = np.min(df["MEP_corr"])
    y_max = np.max(df["MEP_corr"])

    y_min -= 0.1 * (y_max - y_min)
    y_max += 0.4 * (y_max - y_min)
    ax.set_ylim(y_min, y_max)

    ax.set_xlim(-0.75, 19.5)

    for gene in df.index:
        color = "#000000"
        ax.text(
            df.loc[gene, "ranking"],
            df.loc[gene, "MEP_corr"],
            gene,
            rotation="vertical",
            verticalalignment="bottom",
            horizontalalignment="center",
            fontsize=20,
            color=color,
        )

    if SAVE_FIGURES:
        ax.set(xticks=[], xticklabels=[])
        fig.savefig(
            FIG_DIR / "pseudotimekernel" / f"putative_drivers.{FIGURE_FORMAT}",
            format=FIGURE_FORMAT,
            transparent=True,
            bbox_inches="tight",
        )
    plt.show()
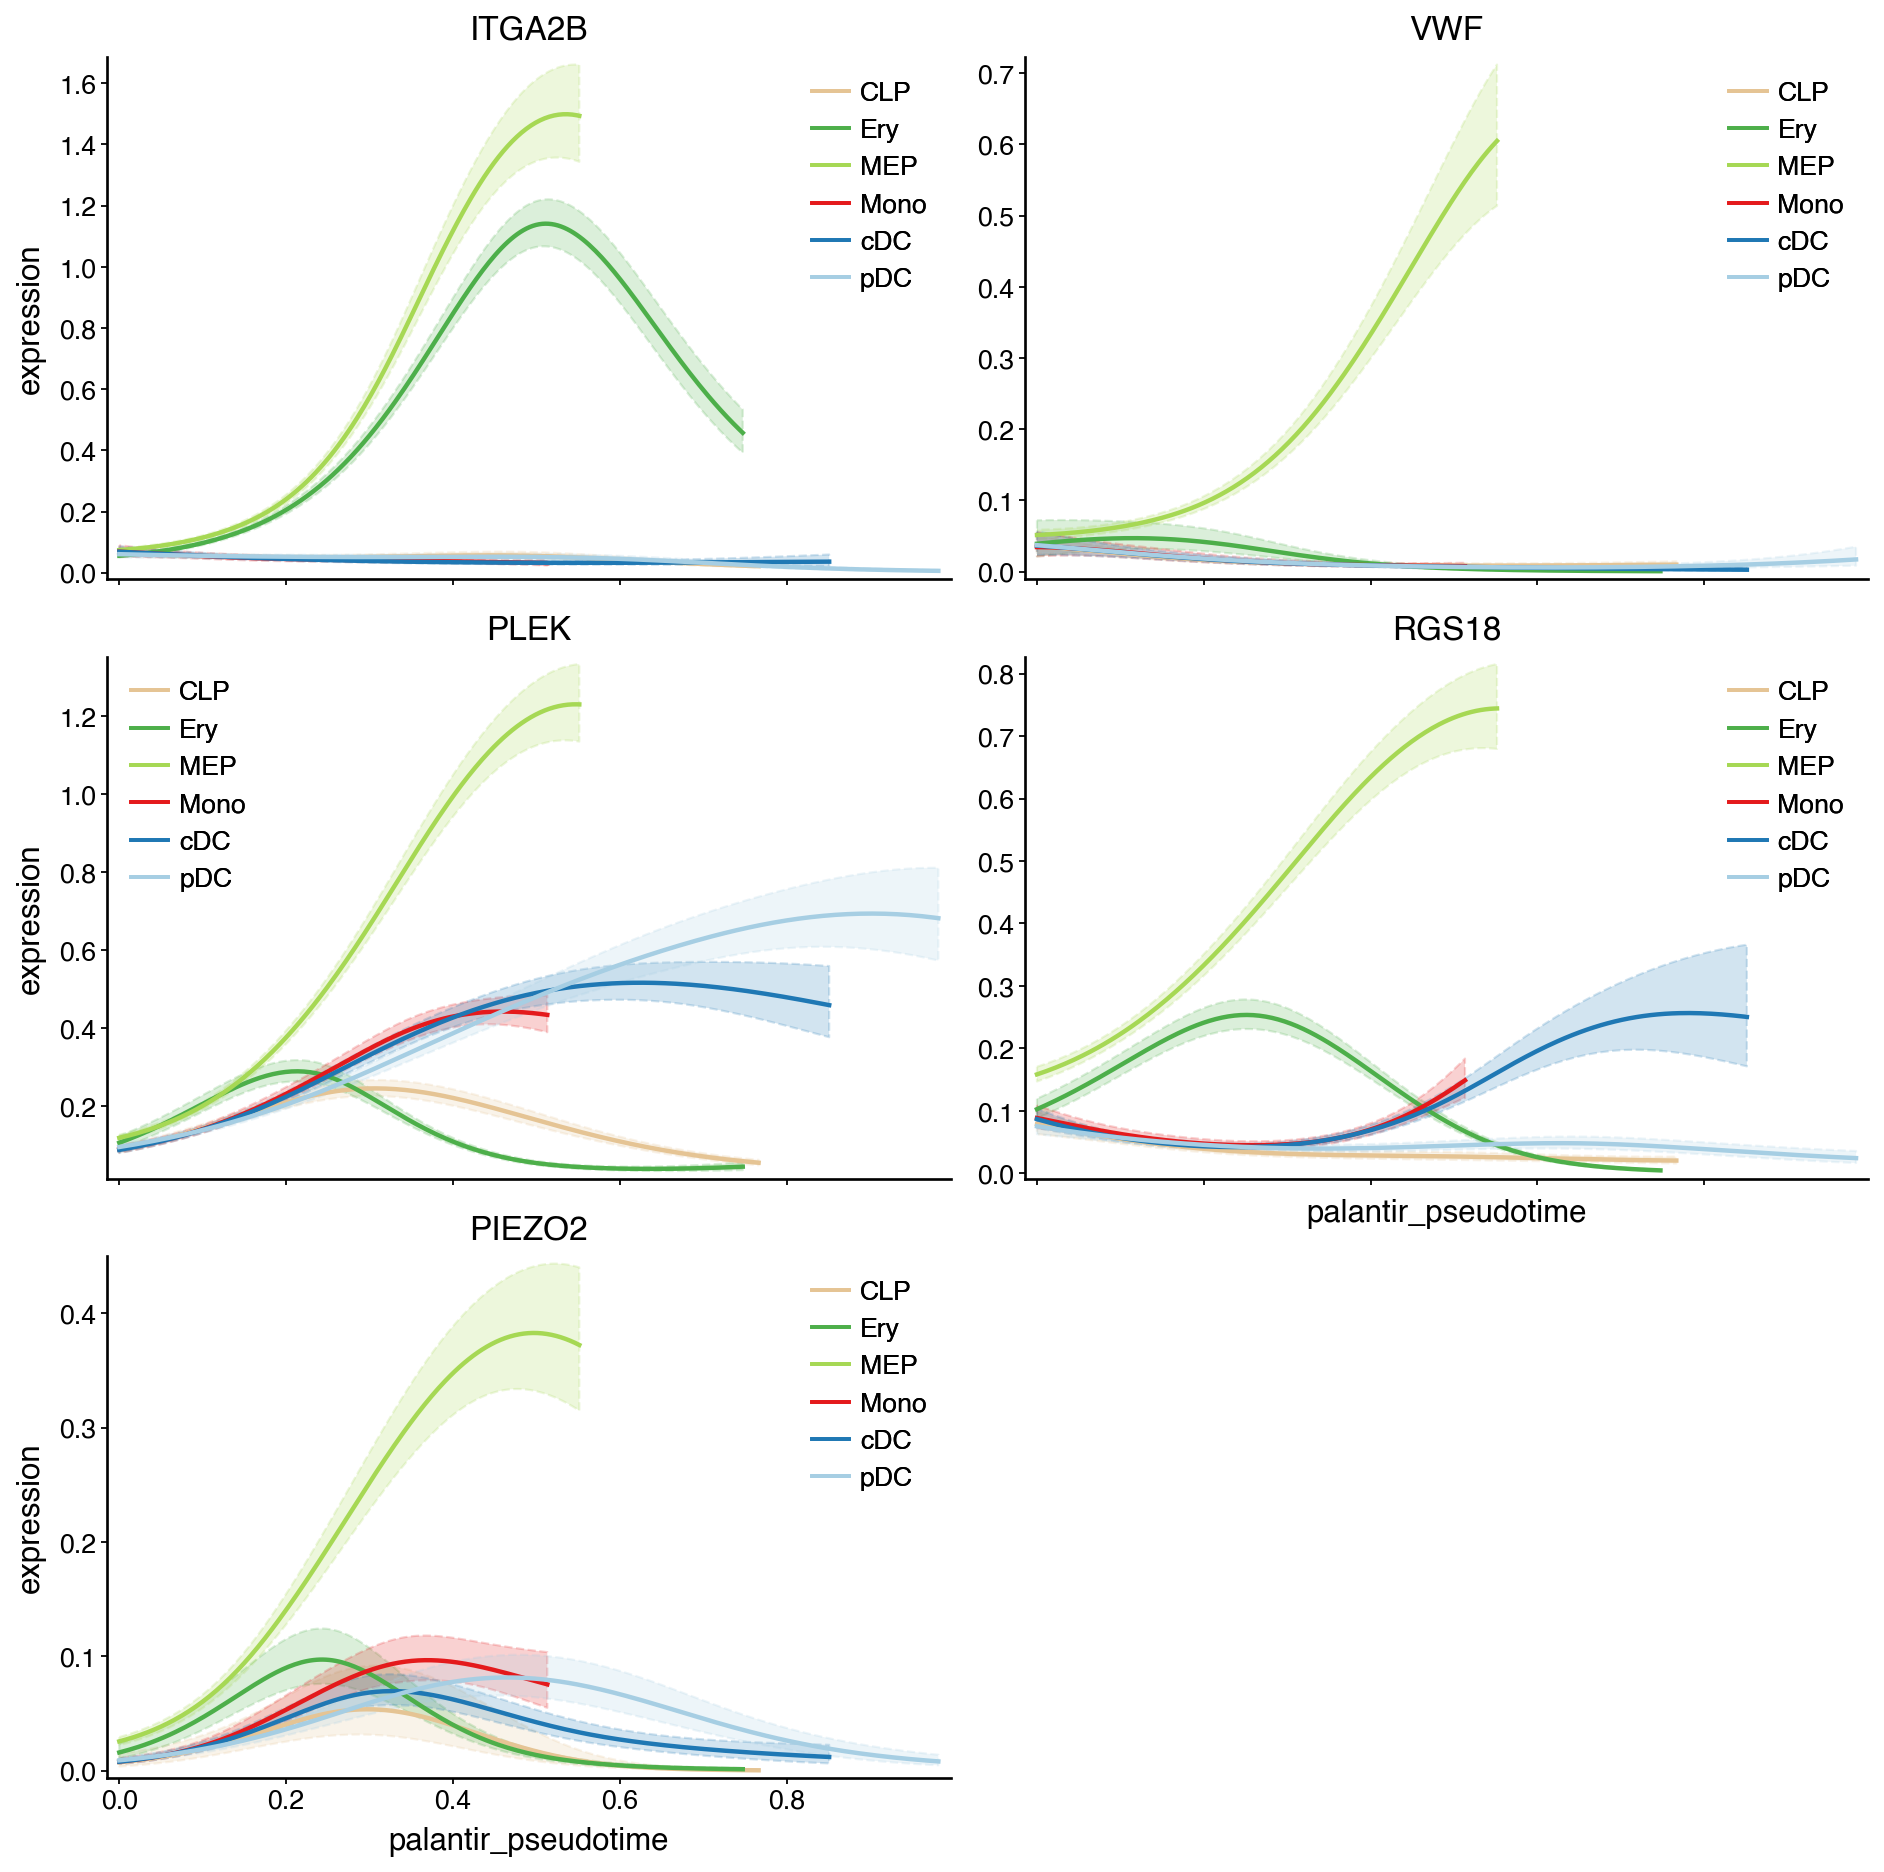
model = cr.models.GAM(adata)

with mplscience.style_context():
    cr.pl.gene_trends(
        adata,
        model=model,
        genes=["ITGA2B", "VWF", "PLEK", "RGS18", "PIEZO2"],
        time_key="palantir_pseudotime",
        hide_cells=True,
        same_plot=True,
    )
    plt.show()

if SAVE_FIGURES:
    fig = cr.pl.gene_trends(
        adata,
        model=model,
        genes=["ITGA2B", "VWF"],
        time_key="palantir_pseudotime",
        hide_cells=True,
        same_plot=True,
        figsize=(8, 4),
        sharey=True,
        return_figure=True,
        # lineage_cmap=["#8e063b", "#f0b98d", "#d5eae7", "#f3e1eb"],
    )

    fig.savefig(
        FIG_DIR / "pseudotimekernel" / f"gene_trends.{FIGURE_FORMAT}",
        format=FIGURE_FORMAT,
        transparent=True,
        bbox_inches="tight",
    )
Computing trends using `1` core(s)
    Finish (0:00:00)
Plotting trends
DEBUG: Key `None` not found in `adata.obs` or `adata.var_names`. Ignoring`
DEBUG: Key `None` not found in `adata.obs` or `adata.var_names`. Ignoring`
DEBUG: Key `None` not found in `adata.obs` or `adata.var_names`. Ignoring`
DEBUG: Key `None` not found in `adata.obs` or `adata.var_names`. Ignoring`
DEBUG: Key `None` not found in `adata.obs` or `adata.var_names`. Ignoring`
DEBUG: Key `None` not found in `adata.obs` or `adata.var_names`. Ignoring`
DEBUG: Key `None` not found in `adata.obs` or `adata.var_names`. Ignoring`
DEBUG: Key `None` not found in `adata.obs` or `adata.var_names`. Ignoring`
DEBUG: Key `None` not found in `adata.obs` or `adata.var_names`. Ignoring`
DEBUG: Key `None` not found in `adata.obs` or `adata.var_names`. Ignoring`
DEBUG: Key `None` not found in `adata.obs` or `adata.var_names`. Ignoring`
DEBUG: Key `None` not found in `adata.obs` or `adata.var_names`. Ignoring`
DEBUG: Key `None` not found in `adata.obs` or `adata.var_names`. Ignoring`
DEBUG: Key `None` not found in `adata.obs` or `adata.var_names`. Ignoring`
DEBUG: Key `None` not found in `adata.obs` or `adata.var_names`. Ignoring`
DEBUG: Key `None` not found in `adata.obs` or `adata.var_names`. Ignoring`
DEBUG: Key `None` not found in `adata.obs` or `adata.var_names`. Ignoring`
DEBUG: Key `None` not found in `adata.obs` or `adata.var_names`. Ignoring`
DEBUG: Key `None` not found in `adata.obs` or `adata.var_names`. Ignoring`
DEBUG: Key `None` not found in `adata.obs` or `adata.var_names`. Ignoring`
DEBUG: Key `None` not found in `adata.obs` or `adata.var_names`. Ignoring`
DEBUG: Key `None` not found in `adata.obs` or `adata.var_names`. Ignoring`
DEBUG: Key `None` not found in `adata.obs` or `adata.var_names`. Ignoring`
DEBUG: Key `None` not found in `adata.obs` or `adata.var_names`. Ignoring`
DEBUG: Key `None` not found in `adata.obs` or `adata.var_names`. Ignoring`
DEBUG: Key `None` not found in `adata.obs` or `adata.var_names`. Ignoring`
DEBUG: Key `None` not found in `adata.obs` or `adata.var_names`. Ignoring`
DEBUG: Key `None` not found in `adata.obs` or `adata.var_names`. Ignoring`
DEBUG: Key `None` not found in `adata.obs` or `adata.var_names`. Ignoring`
DEBUG: Key `None` not found in `adata.obs` or `adata.var_names`. Ignoring`
DEBUG: Key `None` not found in `adata.obs` or `adata.var_names`. Ignoring`
DEBUG: Key `None` not found in `adata.obs` or `adata.var_names`. Ignoring`
DEBUG: Key `None` not found in `adata.obs` or `adata.var_names`. Ignoring`
DEBUG: Key `None` not found in `adata.obs` or `adata.var_names`. Ignoring`
DEBUG: Key `None` not found in `adata.obs` or `adata.var_names`. Ignoring`
estimator.set_terminal_states(TERMINAL_STATES)

with mplscience.style_context():
    estimator.plot_macrostates(which="terminal", basis="umap", legend_loc="right", title="", size=100)

    if SAVE_FIGURES:
        fig, ax = plt.subplots(figsize=(6, 6))
        estimator.plot_macrostates(which="terminal", basis="umap", legend_loc=False, title="", size=100, ax=ax)
        fig.savefig(
            FIG_DIR / "pseudotimekernel" / "terminal_states_set.png",
            dpi=400,
            transparent=True,
            bbox_inches="tight",
        )

    plt.show()
DEBUG: Raising an exception if there are less than `6` cells.
Adding `adata.obs['term_states_fwd']`
       `adata.obs['term_states_fwd_probs']`
       `.terminal_states`
       `.terminal_states_probabilities`
       `.terminal_states_memberships
    Finish`
/Users/philipp/miniforge3/envs/crp-py311/lib/python3.11/site-packages/scvelo/plotting/scatter.py:656: UserWarning: No data for colormapping provided via 'c'. Parameters 'cmap' will be ignored
  smp = ax.scatter(
/Users/philipp/miniforge3/envs/crp-py311/lib/python3.11/site-packages/scvelo/plotting/scatter.py:694: UserWarning: No data for colormapping provided via 'c'. Parameters 'cmap' will be ignored
  ax.scatter(
/Users/philipp/miniforge3/envs/crp-py311/lib/python3.11/site-packages/scvelo/plotting/utils.py:1396: UserWarning: No data for colormapping provided via 'c'. Parameters 'cmap' will be ignored
  ax.scatter(x, y, s=bg_size, marker=".", c=bg_color, zorder=zord - 2, **kwargs)
/Users/philipp/miniforge3/envs/crp-py311/lib/python3.11/site-packages/scvelo/plotting/utils.py:1397: UserWarning: No data for colormapping provided via 'c'. Parameters 'cmap' will be ignored
  ax.scatter(x, y, s=gp_size, marker=".", c=gp_color, zorder=zord - 1, **kwargs)
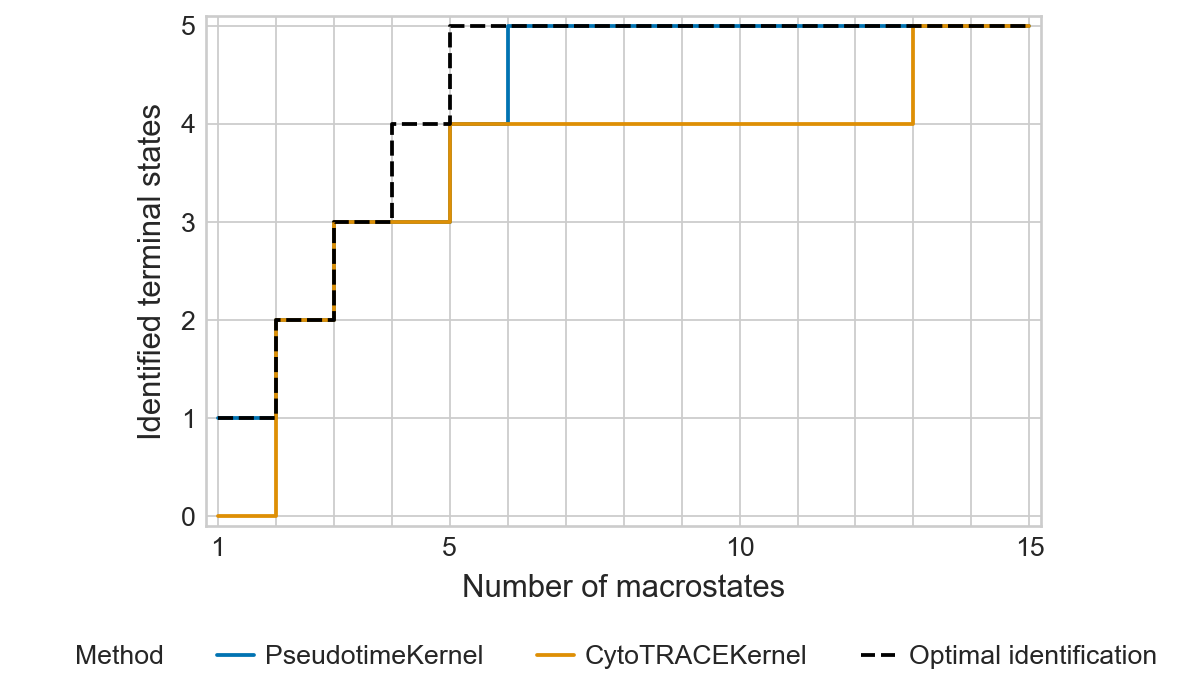
ptk_tsi = estimator._tsi.to_df()
ct_tsi = pd.read_parquet(DATA_DIR / "bone_marrow" / "results" / "ct_tsi.parquet")

ptk_tsi["method"] = "PseudotimeKernel"
ct_tsi["method"] = "CytoTRACEKernel"

df = pd.concat([ptk_tsi, ct_tsi])

palette = {"PseudotimeKernel": "#0173B2", "CytoTRACEKernel": "#DE8F05", "Optimal identification": "#000000"}

if SAVE_FIGURES:
    fname = FIG_DIR / "pseudotimekernel" / f"tsi_ranking.{FIGURE_FORMAT}"
else:
    fname = None

with mplscience.style_context():
    sns.set_style(style="whitegrid")
    plot_tsi(df=df, n_macrostates=15, palette=palette, fname=fname)
    plt.show()
palette = {"PseudotimeKernel": "#DE8F05", "CytoTRACEKernel": "#DE8F05", "Optimal identification": "#000000"}

with mplscience.style_context():
    sns.set_style(style="whitegrid")
    estimator.plot_tsi(palette=palette)
    plt.show()
estimator.compute_fate_probabilities()
with mplscience.style_context():
    estimator.plot_fate_probabilities(same_plot=False, basis="umap", ncols=5)
    plt.show()

if SAVE_FIGURES:
    bdata = adata.copy()
    bdata.obs[estimator.fate_probabilities.names.tolist()] = estimator.fate_probabilities.X

    for lineage in estimator.fate_probabilities.names.tolist():
        with mplscience.style_context():
            fig, ax = plt.subplots(figsize=(6, 6))
            scv.pl.scatter(bdata, basis="umap", color=lineage, cmap="viridis", title="", colorbar=False, ax=ax)
            fig.savefig(
                FIG_DIR / "pseudotimekernel" / f"{lineage.lower()}_fate_terminal_set.png",
                dpi=400,
                transparent=True,
                bbox_inches="tight",
            )
            plt.show()
    del bdata
Computing fate probabilities
DEBUG: Solving the linear system using `PETSc` solver `'gmres'` on `1` core(s) with no preconditioner and `tol=1e-06`
Adding `adata.obsm['lineages_fwd']`
       `.fate_probabilities`
    Finish (0:00:00)
cluster_key = "celltype"
rep = "X_pca"

ptk_cbc = []
for source, target in tqdm(STATE_TRANSITIONS):
    _cbc = ptk.cbc(source=source, target=target, cluster_key=cluster_key, rep=rep)

    ptk_cbc.append(
        pd.DataFrame(
            {
                "state_transition": [f"{source} - {target}"] * len(_cbc),
                "cbc": _cbc,
            }
        )
    )
ptk_cbc = pd.concat(ptk_cbc)

if SAVE_RESULTS:
    ptk_cbc.to_parquet(DATA_DIR / "bone_marrow" / "results" / "palantir_cbc.parquet")

ptk_cbc.head()
100%|██████████| 8/8 [00:00<00:00, 12.67it/s]
| state_transition | cbc | |
|---|---|---|
| 0 | HSC - MEP | 0.682481 |
| 1 | HSC - MEP | 0.612722 |
| 2 | HSC - MEP | 0.715823 |
| 3 | HSC - MEP | 0.520870 |
| 4 | HSC - MEP | 0.850975 |
ctk_cbc = pd.read_parquet(DATA_DIR / "bone_marrow" / "results" / "ct_cbc.parquet")
cbc_ratio = pd.DataFrame(
    {"Log ratio": np.log((ptk_cbc["cbc"] + 1) / (ctk_cbc["cbc"] + 1)), "State transition": ptk_cbc["state_transition"]}
)
ttest_res, significances = get_ttest_res(cbc_ratio)
palette = get_palette(significances=significances)

if SAVE_FIGURES:
    fpath = FIG_DIR / "pseudotimekernel" / "cbc_ratio.svg"
else:
    fpath = None
plot_cbc_ratio(cbc=cbc_ratio, palette=palette, figsize=(12, 4), fpath=fpath)