Aligning two MERFISH sections from landmarks alone#
The cheapest of the alignments: align_landmarks solves for the affine in closed form from
paired points. No iteration, no rasterization, no images – and no diffeomorphism, so it can
only express what an affine can.
Upstream’s equivalent is merfish-merfish-alignment-affine-only-with-points.
STalign’s own version of this analysis: merfish-merfish-alignment-affine-only-with-points.
Inputs#
import anndata as ad, numpy as np, pandas as pd

MERFISH = 'merfish_data/datasets_mouse_brain_map_BrainReceptorShowcase_Slice2_Replicate'

def section(replicate):
    df = pd.read_csv(f'{MERFISH}{replicate}_cell_metadata_S2R{replicate}.csv.gz')
    xy = np.c_[df['center_x'], df['center_y']].astype(float)
    return ad.AnnData(X=np.zeros((len(xy), 1)), obsm={'spatial': xy})

# S2R2 is the reference; S2R3 is the section that moves.
ref, query = section(2), section(3)

# Thirteen landmark pairs picked by hand, stored as `(x, y)` -- which is what squidpy's public
# API takes, so unlike upstream's own notebook nothing here transposes them on the way in.
landmarks = {r: np.asarray(np.load(f'merfish_data/Merfish_S2_R{r}_points.npy',
                                   allow_pickle=True).item()['all'], dtype=float)
             for r in (2, 3)}

# They stay plain arrays: landmarks are correspondences *between* the two sections rather
# than observations *of* either, so they have no `obs` axis to hang off -- and every
# function here takes them as arrays.
print(f'{ref.n_obs} reference cells, {query.n_obs} query cells, '
      f'{len(landmarks[2])} landmark pairs')
84172 reference cells, 85958 query cells, 13 landmark pairs
The fit#
fit chooses how much freedom the affine gets. "similarity" allows rotation, one uniform
scale and translation – four degrees of freedom. "affine" adds non-uniform scale and shear,
for six. The constrained fit is the safer default precisely because it cannot shear a
section that should not be sheared; use it unless the extra two degrees are earned.
from squidpy.experimental.tl import align_landmarks

fits = {name: align_landmarks(landmarks[2], landmarks[3], method=name)
        for name in ('similarity', 'affine')}

for name, matrix in fits.items():
    moved = landmarks[3] @ matrix[:2, :2].T + matrix[:2, 2]
    residual = np.linalg.norm(moved - landmarks[2], axis=1)
    print(f'{name:<11} residual over the 13 landmarks: '
          f'median {np.median(residual):7.1f} um, worst {residual.max():7.1f} um')
print()
print('affine:'); print(fits['affine'].round(3))
similarity  residual over the 13 landmarks: median   144.6 um, worst   395.3 um
affine      residual over the 13 landmarks: median   120.5 um, worst   364.7 um

affine:
[[ 6.870000e-01  6.900000e-01 -1.133391e+03]
 [-7.630000e-01  7.570000e-01  6.071844e+03]
 [ 0.000000e+00  0.000000e+00  1.000000e+00]]
What it does to the section#
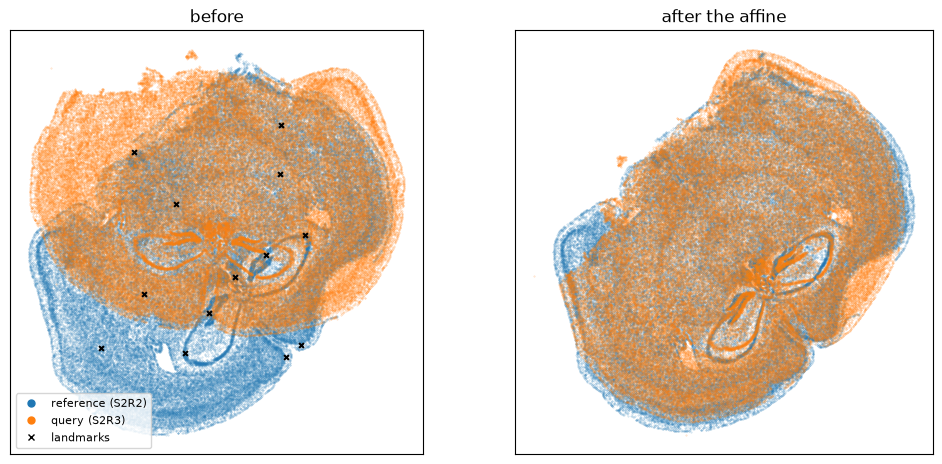
Six degrees of freedom is the whole model here, so the two point clouds agree where the tissue
moved rigidly and disagree wherever it deformed. That residual disagreement is exactly what
stalign_align_obs exists to absorb – see merfish-merfish.
import matplotlib.pyplot as plt
from matplotlib.lines import Line2D

matrix = fits['affine']
moved = query.obsm['spatial'] @ matrix[:2, :2].T + matrix[:2, 2]

fig, ax = plt.subplots(1, 2, figsize=(12, 5.5))
for a, (pts, title) in zip(ax, [(query.obsm['spatial'], 'before'),
                                (moved, 'after the affine')], strict=True):
    a.scatter(*ref.obsm['spatial'].T, s=0.12, alpha=0.3, label='reference (S2R2)')
    a.scatter(*pts.T, s=0.12, alpha=0.3, label='query (S2R3)')
    a.set_title(title); a.set_aspect('equal'); a.invert_yaxis()
    a.set_xticks([]); a.set_yticks([])
ax[0].scatter(*landmarks[2].T, s=12, c='k', marker='x')
ax[0].legend(handles=[Line2D([], [], marker='o', ls='', ms=5, color='tab:blue', label='reference (S2R2)'),
                      Line2D([], [], marker='o', ls='', ms=5, color='tab:orange', label='query (S2R3)'),
                      Line2D([], [], marker='x', ls='', ms=5, color='k', label='landmarks')],
             loc='lower left', fontsize=8)
<matplotlib.legend.Legend at 0x7f38caf8c6e0>