Aligning two MERFISH sections#
Two replicate sections of the same tissue brought into a common frame, entirely through
squidpy’s public API: stalign_align_obs fits a diffeomorphism directly between two point
clouds, rasterizing both sides itself.
Upstream’s equivalent is merfish-merfish-alignment, which rotates the source by hand before
rasterizing. Here the paired landmarks supply the starting affine instead.
STalign’s own version of this analysis: merfish-merfish-alignment.
Inputs#
import anndata as ad, numpy as np, pandas as pd

MERFISH = 'merfish_data/datasets_mouse_brain_map_BrainReceptorShowcase_Slice2_Replicate'

def section(replicate):
    df = pd.read_csv(f'{MERFISH}{replicate}_cell_metadata_S2R{replicate}.csv.gz')
    xy = np.c_[df['center_x'], df['center_y']].astype(float)
    return ad.AnnData(X=np.zeros((len(xy), 1)), obsm={'spatial': xy})

# S2R2 is the reference; S2R3 is the section that moves.
ref, query = section(2), section(3)

# Thirteen landmark pairs picked by hand, stored as `(x, y)` -- which is what squidpy's public
# API takes, so unlike upstream's own notebook nothing here transposes them on the way in.
landmarks = {r: np.asarray(np.load(f'merfish_data/Merfish_S2_R{r}_points.npy',
                                   allow_pickle=True).item()['all'], dtype=float)
             for r in (2, 3)}

# They stay plain arrays: landmarks are correspondences *between* the two sections rather
# than observations *of* either, so they have no `obs` axis to hang off -- and every
# function here takes them as arrays.
print(f'{ref.n_obs} reference cells, {query.n_obs} query cells, '
      f'{len(landmarks[2])} landmark pairs')
84172 reference cells, 85958 query cells, 13 landmark pairs
The fit#
Handing over the landmarks does two separate things: they derive the starting affine, and they
stay in the objective as a matching term weighted by sigmaP – so the fit is pulled toward
them rather than merely started there.
dx and blur are the rasterization the solver does internally; upstream’s notebook uses
30 um and 1.5, and epV=50 is its one departure from the solver defaults.
from squidpy.experimental.tl import stalign_align_obs

fit = stalign_align_obs(
    ref, query, spatial_key='spatial',
    landmarks_ref=landmarks[2], landmarks_query=landmarks[3],
    dx=30.0, blur=1.5, niter=10000, epV=50,
)
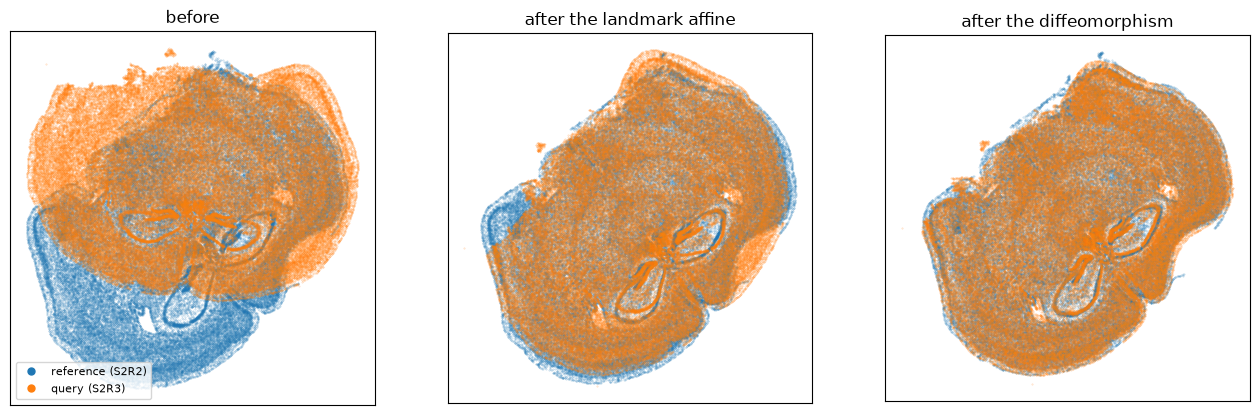
print(f'{fit.n_iter} iterations, objective '
      f'{float(fit.energies[0]):.0f} -> {float(fit.energies[-1]):.0f}')
10000 iterations, objective 4322 -> 2512
Where the cells land#
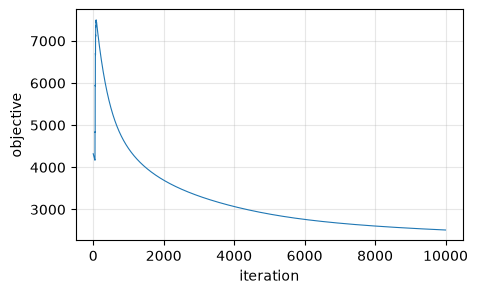
StalignFit.transform writes the mapped coordinates straight back into the query’s obsm,
so the alignment ends up on the object rather than in a local variable. It evaluates the fitted
map at each point, so a cell lands where it lands rather than at the nearest raster cell. The middle panel is what the landmark affine alone achieves, for
comparison – the difference between the two is what the diffeomorphism bought.
import matplotlib.pyplot as plt
from matplotlib.lines import Line2D
from squidpy.experimental.tl import align_landmarks

fit.transform(query, key_added='aligned')
moved = query.obsm['aligned']
affine = align_landmarks(landmarks[2], landmarks[3], method='affine')
affine_only = query.obsm['spatial'] @ affine[:2, :2].T + affine[:2, 2]

fig, ax = plt.subplots(1, 3, figsize=(16, 5.5))
for a, (pts, title) in zip(ax, [
        (query.obsm['spatial'], 'before'),
        (affine_only, 'after the landmark affine'),
        (moved, 'after the diffeomorphism')], strict=True):
    a.scatter(*ref.obsm['spatial'].T, s=0.12, alpha=0.3, label='reference (S2R2)')
    a.scatter(*pts.T, s=0.12, alpha=0.3, label='query (S2R3)')
    a.set_title(title); a.set_aspect('equal'); a.invert_yaxis()
    a.set_xticks([]); a.set_yticks([])
ax[0].legend(handles=[Line2D([], [], marker='o', ls='', ms=5, color=c, label=l)
                     for c, l in (('tab:blue', 'reference (S2R2)'), ('tab:orange', 'query (S2R3)'))],
             loc='lower left', fontsize=8)
<matplotlib.legend.Legend at 0x7fb67cfb1d30>
Convergence#
energies = np.asarray(fit.energies)[: fit.n_iter]
plt.figure(figsize=(5, 3))
plt.plot(energies, lw=0.8)
plt.xlabel('iteration'); plt.ylabel('objective'); plt.grid(alpha=0.3)