SpaGE tutorial#
SpaGE’s tutorial predicts unmeasured genes in osmFISH mouse somatosensory cortex from the
AllenSSp scRNA-seq data, written against
squidpy.experimental.tl.impute_spage.
Loading and normalization are upstream’s, line for line; each SpaGE(...) call becomes one impute_spage call
with the same n_pv=30 and upstream’s hard-coded 50 neighbors and 0.3 cosine threshold, which are squidpy’s defaults.
The datasets are the ones upstream points to, from Zenodo. The last
section runs upstream’s SpaGE() from this repository’s pinned copy on the same inputs.
import loompy
import matplotlib.pyplot as plt
import numpy as np
import pandas as pd
import scipy.stats as st
from anndata import AnnData

import squidpy as sq
Load and preprocess the AllenSSp dataset#
Upstream’s filtering and log-CPM normalization, then cells as rows.
RNA_data = pd.read_csv("SSp_exons_matrix.csv", header=0, index_col=0, sep=",")

# filter lowly expressed genes
Genes_count = np.sum(RNA_data > 0, axis=1)
RNA_data = RNA_data.loc[Genes_count >= 10, :]
del Genes_count


# Normalization
def Log_Norm_cpm(x):
    return np.log(((x / np.sum(x)) * 1000000) + 1)


RNA_data = RNA_data.apply(Log_Norm_cpm, axis=0)
adata_rna = AnnData(RNA_data.T)
adata_rna
AnnData object with n_obs × n_vars = 5613 × 30527
    layers: None (.X)
Load and preprocess the osmFISH dataset#
ds = loompy.connect("osmFISH_SScortex_mouse_all_cells.loom")
FISH_Genes = ds.ra["Gene"]
colAtr = ds.ca.keys()

df = pd.DataFrame()
for i in colAtr:
    df[i] = ds.ca[i]

osmFISH_meta = df.iloc[np.where(df.Valid == 1)[0], :]
osmFISH_data = ds[:, :]
osmFISH_data = osmFISH_data[:, np.where(df.Valid == 1)[0]]
osmFISH_data = pd.DataFrame(data=osmFISH_data, index=FISH_Genes)

del ds, colAtr, i, df, FISH_Genes

# Select cortical regions only to match the AllenSSp dataset
Cortex_Regions = ["Layer 2-3 lateral", "Layer 2-3 medial", "Layer 3-4", "Layer 4", "Layer 5", "Layer 6", "Pia Layer 1"]
Cortical = np.stack([i in Cortex_Regions for i in osmFISH_meta.Region])

osmFISH_meta = osmFISH_meta.iloc[Cortical, :]
osmFISH_data = osmFISH_data.iloc[:, Cortical]
del Cortex_Regions, Cortical

# Normalization
cell_count = np.sum(osmFISH_data, axis=0)


def Log_Norm_spatial(x):
    return np.log(((x / np.sum(x)) * np.median(cell_count)) + 1)


osmFISH_data = osmFISH_data.apply(Log_Norm_spatial, axis=0)
adata_fish = AnnData(osmFISH_data.T, obs=osmFISH_meta.set_index(osmFISH_data.columns.astype(str)))
adata_fish.obsm["spatial"] = adata_fish.obs[["X", "Y"]].to_numpy()
adata_fish
AnnData object with n_obs × n_vars = 3405 × 33
    obs: 'CellID', 'ClusterID', 'ClusterName', 'Region', 'Total_molecules', 'Valid', 'X', 'Y', '_tSNE_1', '_tSNE_2', 'size_pix', 'size_um2'
    obsm: 'spatial'
    layers: None (.X)
Validate SpaGE using leave-one-gene-out cross validation#
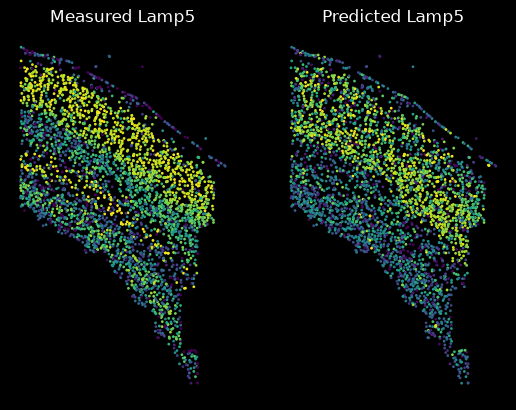
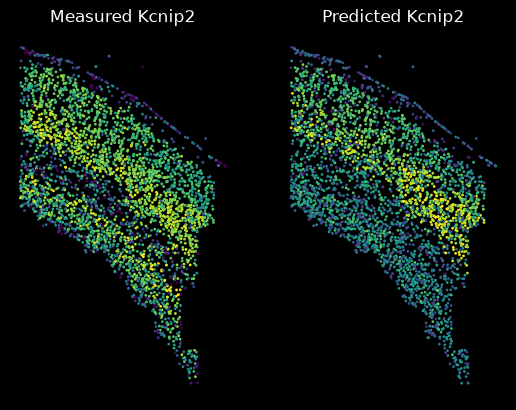
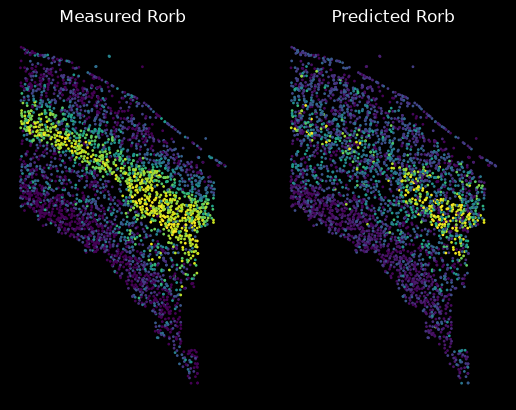
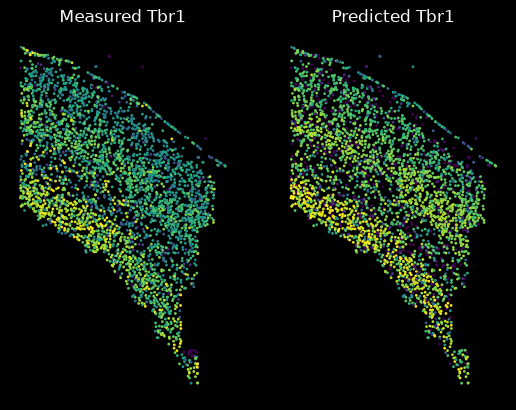
Each gene is dropped from the osmFISH data, predicted from the AllenSSp data, and compared with its measurement.
def plot_pair(left, right, titles):
    fig, axs = plt.subplots(1, 2)
    for ax, values, title in zip(axs, (left, right), titles, strict=True):
        values = np.minimum(values, np.percentile(values, 99))
        ax.axis("off")
        ax.scatter(adata_fish.obs["X"], adata_fish.obs["Y"], s=1, c=values)
        ax.set_title(title, fontsize=12)


Gene_set = ["Lamp5", "Kcnip2", "Rorb", "Tbr1", "Syt6"]
Correlations = pd.Series(index=Gene_set, dtype=float)
plt.style.use("dark_background")

for gene in Gene_set:
    imputed = sq.experimental.tl.impute_spage(
        adata_rna, adata_fish[:, adata_fish.var_names != gene], genes=[gene], n_pv=30, inplace=False
    )
    measured = adata_fish[:, gene].X.ravel()
    Correlations[gene] = st.spearmanr(measured, imputed[gene])[0]
    plot_pair(measured, imputed[gene].to_numpy(), [f"Measured {gene}", f"Predicted {gene}"])
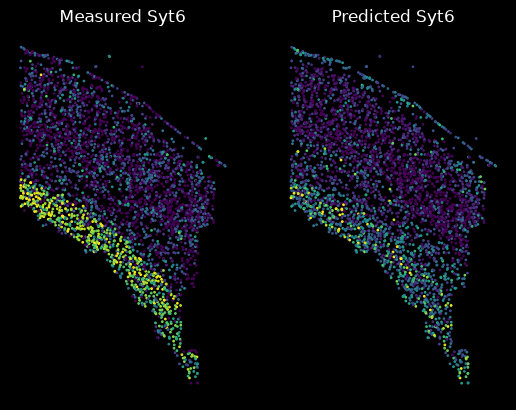
Correlation values between measured and predicted expressions#
Beside the values upstream’s tutorial printed. They agree to three decimals; the tutorial ran on 2020’s scikit-learn and numpy, and today’s upstream gives the same values as squidpy (see the last section).
pd.DataFrame(
    {
        "squidpy": Correlations,
        "upstream tutorial": [0.412915, 0.419512, 0.497496, 0.543648, 0.379520],
    }
)
| squidpy | upstream tutorial | |
|---|---|---|
| Lamp5 | 0.412915 | 0.412915 |
| Kcnip2 | 0.419524 | 0.419512 |
| Rorb | 0.497792 | 0.497496 |
| Tbr1 | 0.543572 | 0.543648 |
| Syt6 | 0.380957 | 0.379520 |
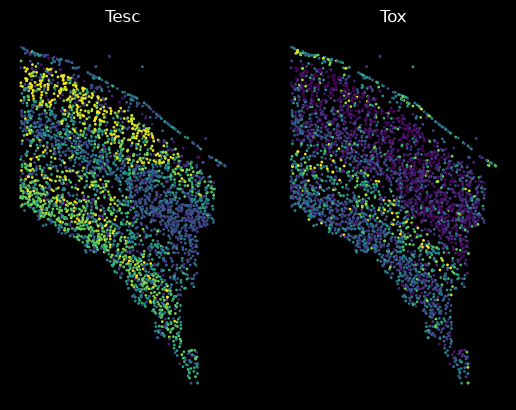
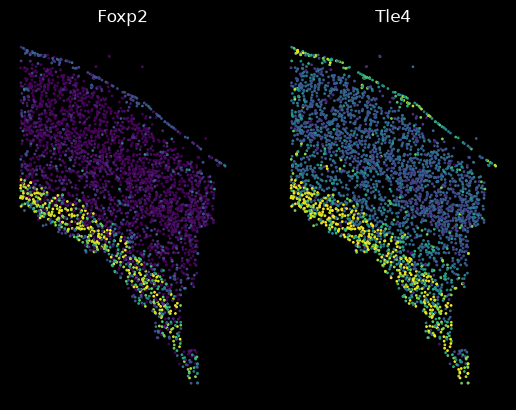
Prediction of new unmeasured spatial gene patterns#
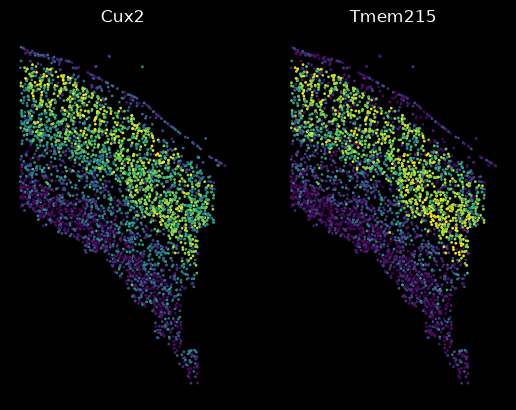
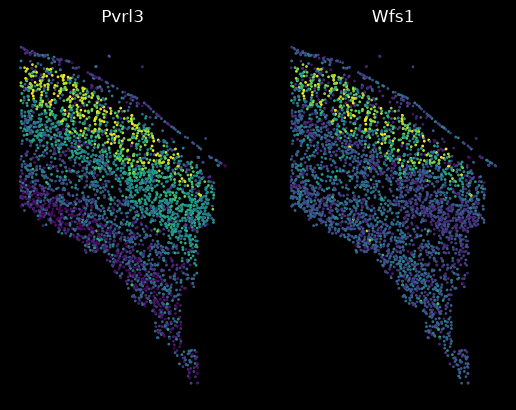
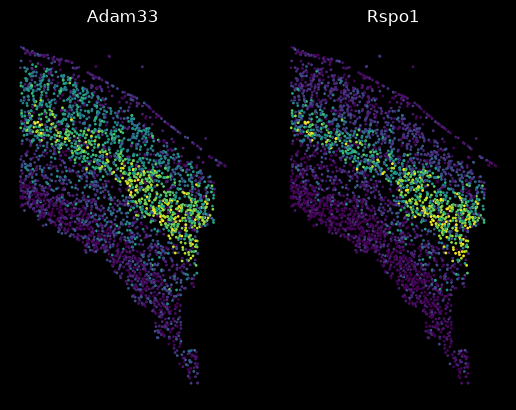
Ten genes osmFISH does not measure, each with a layer-specific pattern in the Allen ISH data.
new_genes = ["Cux2", "Tmem215", "Pvrl3", "Wfs1", "Adam33", "Rspo1", "Tesc", "Tox", "Foxp2", "Tle4"]
sq.experimental.tl.impute_spage(adata_rna, adata_fish, genes=new_genes, n_pv=30, key_added="spage")
Imp_New_Genes = adata_fish.obsm["spage"]

for i in range(0, 10, 2):
    plot_pair(Imp_New_Genes[new_genes[i]].to_numpy(), Imp_New_Genes[new_genes[i + 1]].to_numpy(), new_genes[i : i + 2])
Against upstream#
Upstream’s SpaGE() from this repository’s pinned copy (vendor/SpaGE), on the DataFrames the sections above
built.
from squidpy_ports.spage import upstream

upstream_new = upstream.load().SpaGE(osmFISH_data.T, RNA_data.T, n_pv=30, genes_to_predict=new_genes)
difference = np.abs(Imp_New_Genes[new_genes].to_numpy() - upstream_new[new_genes].to_numpy())
print(f"max |squidpy - upstream| = {difference.max():.2e}, largest value = {upstream_new.to_numpy().max():.2f}")
print(f"cells differing by more than 1e-8: {int((difference.max(axis=1) > 1e-8).sum())} of {len(difference)}")
max |squidpy - upstream| = 4.44e-15, largest value = 5.89
cells differing by more than 1e-8: 0 of 3405