Tangram tutorial#
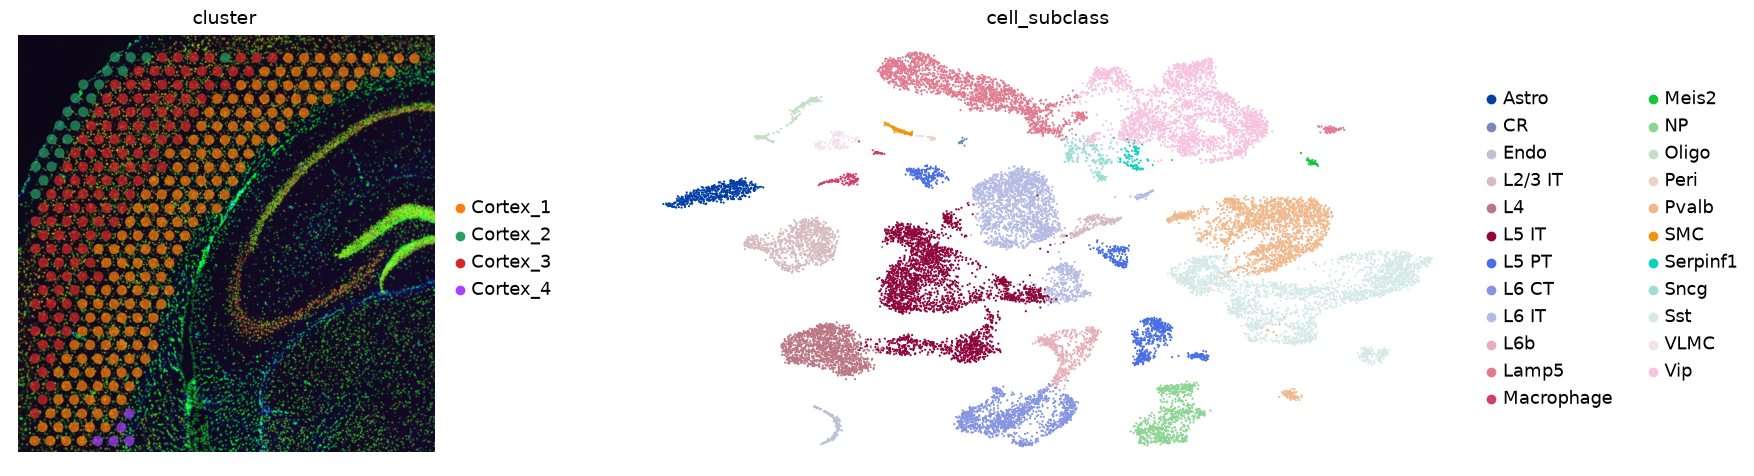
The mode="cells" part of Tangram’s tutorial, which maps the
sc_mouse_cortex scRNA-seq reference onto the cortex of the visium_fluo Visium section, written against
squidpy.experimental.tl.impute_tangram.
The port maps cells, keeps the mapping and projects genes, so the tutorial’s cell-type maps, gene plots and score
of every gene are reproduced here. Its mode="constrained", segmentation and deconvolution are not part of the
port.
The last section runs upstream Tangram from this repository’s pinned copy on the same inputs.
import matplotlib.pyplot as plt
import numpy as np
import pandas as pd
import scanpy as sc

import squidpy as sq

sc.settings.set_figure_params(dpi=50)  # the panels sit on the section's high-resolution image
adata_st = sq.datasets.visium_fluo_adata_crop()
adata_st = adata_st[adata_st.obs.cluster.isin([f"Cortex_{i}" for i in np.arange(1, 5)])].copy()
adata_sc = sq.datasets.sc_mouse_cortex()
fig, axs = plt.subplots(1, 2, figsize=(20, 5))
sc.pl.spatial(adata_st, color="cluster", alpha=0.7, frameon=False, show=False, ax=axs[0])
sc.pl.umap(adata_sc, color="cell_subclass", size=10, frameon=False, show=False, ax=axs[1])
plt.tight_layout()
The tutorial trains on the top 100 marker genes of each cell subclass.
sc.tl.rank_genes_groups(adata_sc, groupby="cell_subclass", use_raw=False)
markers_df = pd.DataFrame(adata_sc.uns["rank_genes_groups"]["names"]).iloc[0:100, :]
markers = list(np.unique(markers_df.melt().value.values))
len(markers)
1401
tg.pp_adatas lowercases every gene name, so that names match across species capitalizations; impute_tangram
compares names as given, so they are lowercased here instead.
impute_tangram trains on every gene the two datasets share, so the query passed to it is the section restricted
to the marker genes. One consequence: its "rna_count_based" prior counts those genes only, where tg.pp_adatas
counts every gene of the section.
for adata in (adata_sc, adata_st):
    adata.var_names = adata.var_names.str.lower()
    adata.var_names_make_unique()

training = sorted(set(map(str.lower, markers)) & set(adata_st.var_names))
shared = sorted(set(adata_sc.var_names) & set(adata_st.var_names))
f"{len(training)} training genes, {len(shared) - len(training)} test genes"
'1281 training genes, 13822 test genes'
query = adata_st[:, training].copy()
sq.experimental.tl.impute_tangram(adata_sc, query, genes=shared, density_prior="rna_count_based", n_epochs=500, rng=0)
adata_st.obsm["tangram"] = query.obsm["tangram"]
mapping = query.obsm["tangram_mapping"]  # query spots x reference cells
mapping.shape
WARNING: Ignoring `1` shared genes unexpressed in the reference or the query
(324, 21697)
Cell types#
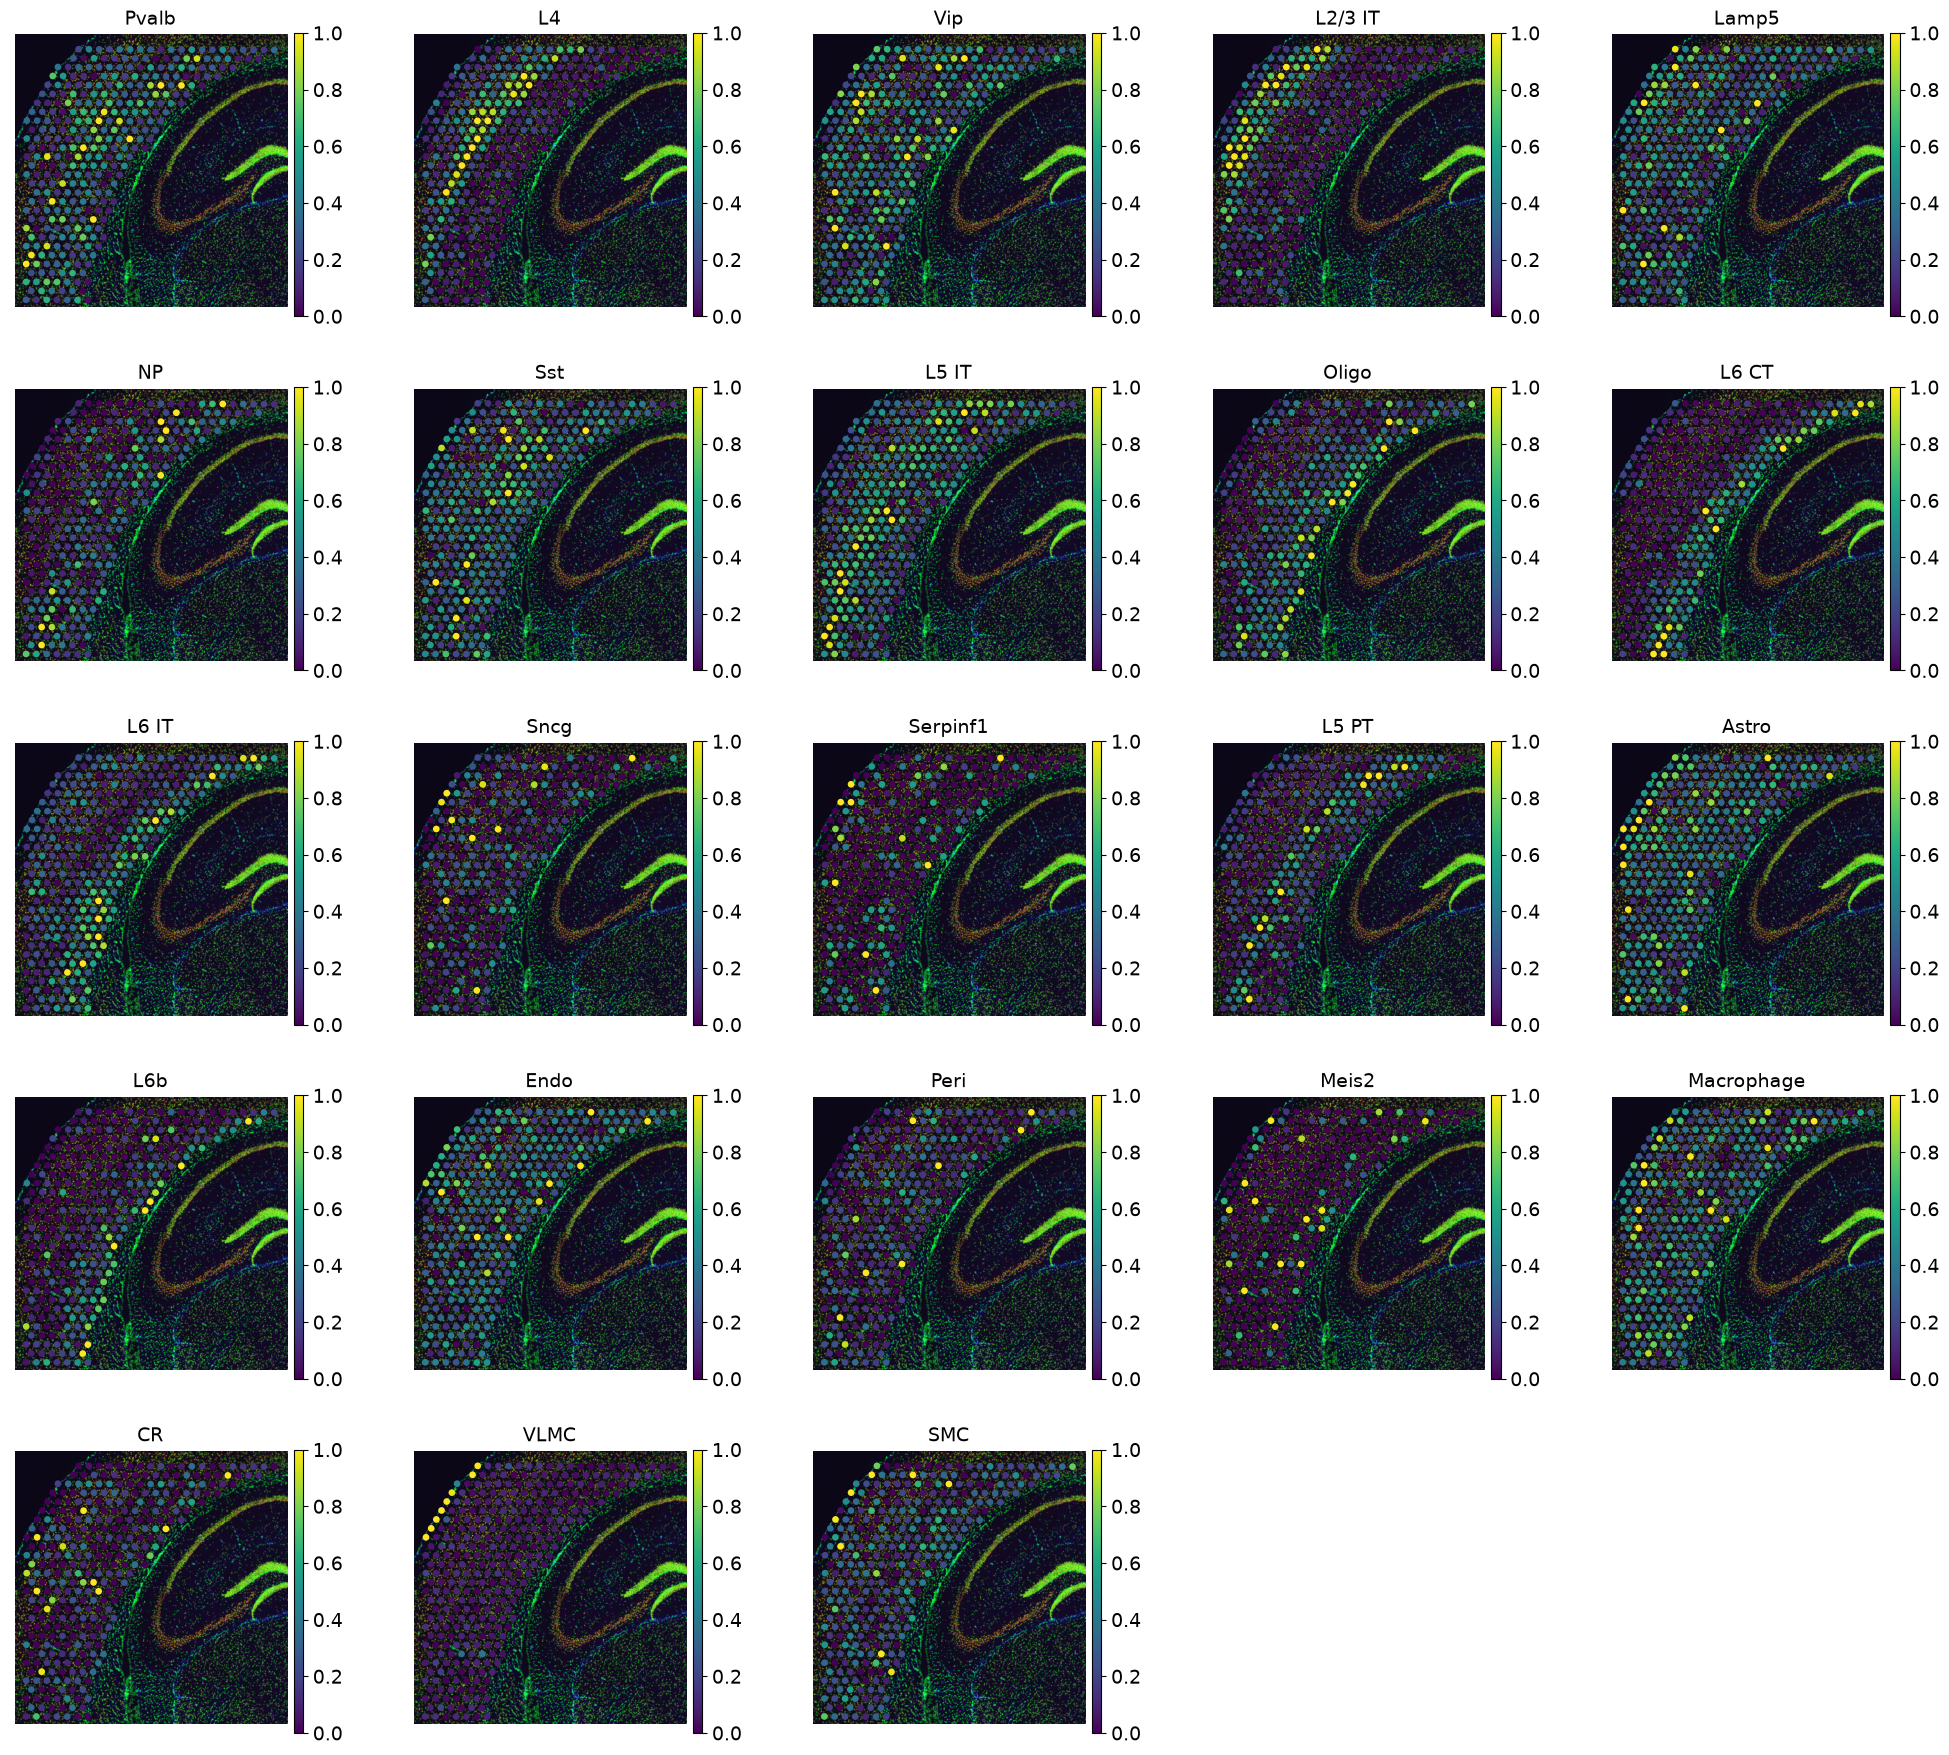
tg.project_cell_annotations sums the mapping over the cells of each subclass, and tg.plot_cell_annotation_sc
shows each subclass’s share of every spot, clipped at the 2nd and 98th percentile (perc=0.02) and scaled to
[0, 1].
def scaled(df, perc=0.02):
    # each column clipped at its `perc` and `1 - perc` quantiles and scaled to [0, 1], as Tangram's plots do
    lo, hi = df.quantile(perc), df.quantile(1 - perc)
    return ((df.clip(lo, hi, axis=1) - lo) / (hi - lo)).fillna(0)


annotation = pd.get_dummies(adata_sc.obs["cell_subclass"]).astype(float)
cell_types = pd.DataFrame(mapping @ annotation.to_numpy(), index=adata_st.obs_names, columns=annotation.columns)
annotation_list = list(pd.unique(adata_sc.obs["cell_subclass"]))
adata_st.obs[annotation_list] = scaled(cell_types[annotation_list])
sc.pl.spatial(adata_st, color=annotation_list, ncols=5, frameon=False, vmin=0, vmax=1, cmap="viridis")
adata_st.obs.drop(columns=annotation_list, inplace=True)
Measured and predicted genes#
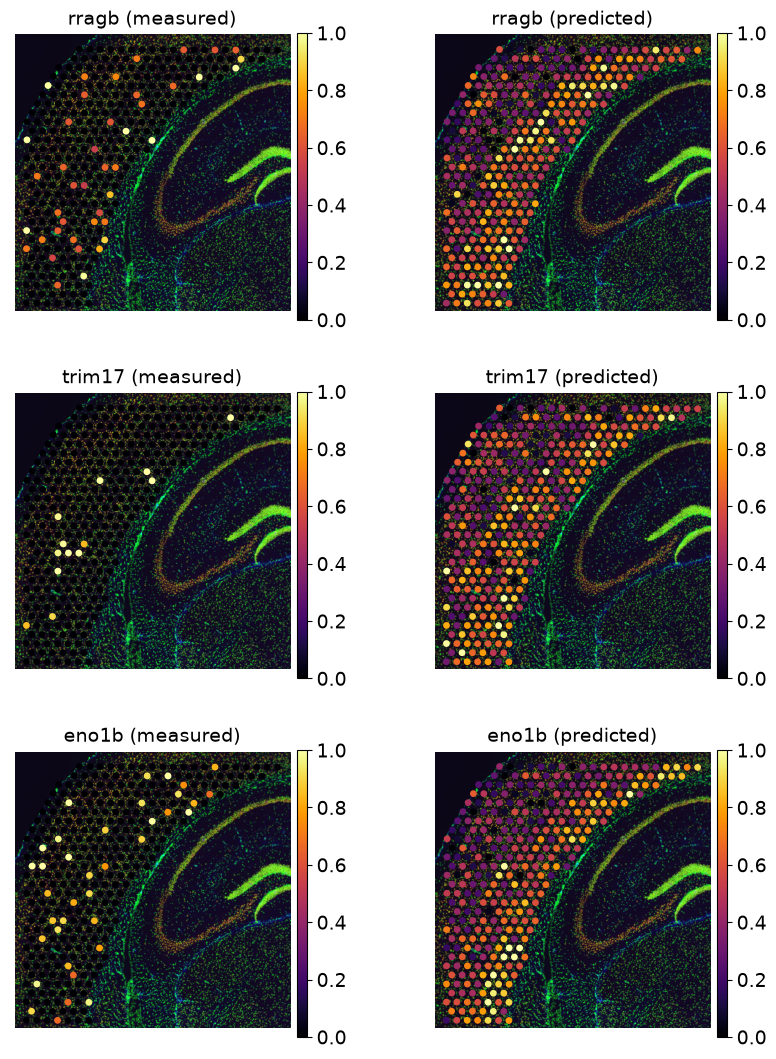
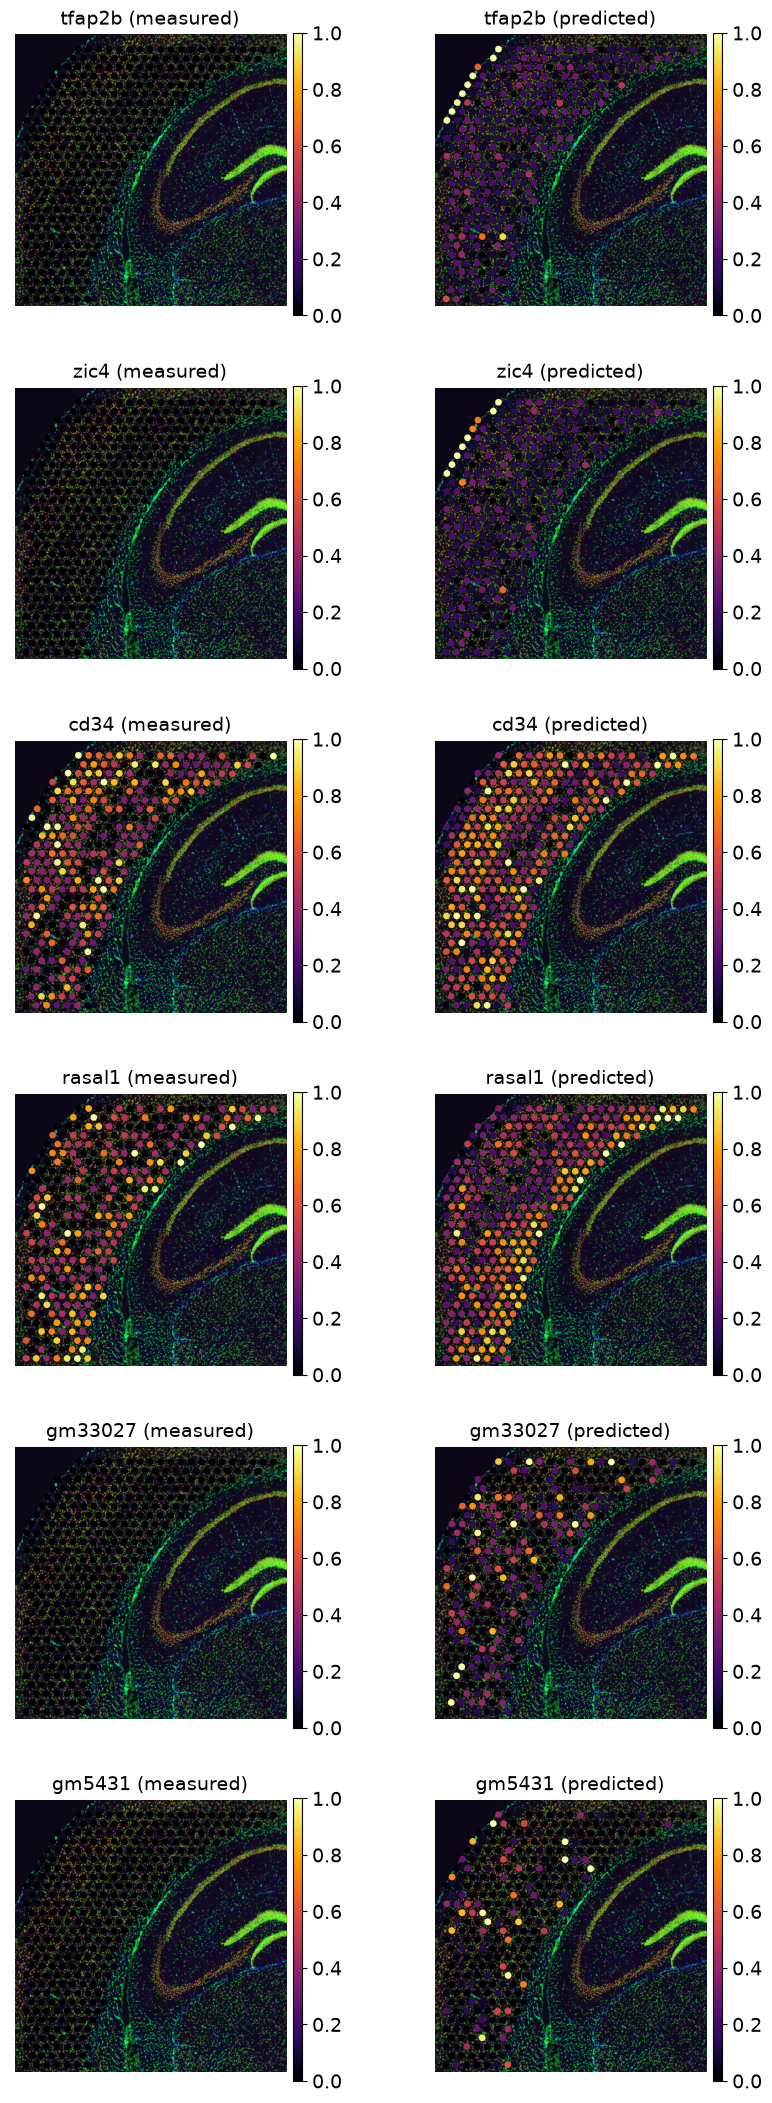
tg.plot_genes_sc shows each gene measured and predicted on the tissue, each scaled to its own range. First three
training genes, then the test genes the tutorial picks; a gene the current release of the datasets no longer has
in both is skipped, with a note.
def plot_genes(genes):
    if missing := [g for g in genes if g not in shared]:
        print(f"not measured in this version of the datasets, skipped: {missing}")
    if not (genes := [g for g in genes if g in shared]):
        return
    measured = scaled(adata_st[:, genes].to_df()).add_suffix(" (measured)")
    predicted = scaled(adata_st.obsm["tangram"][genes]).add_suffix(" (predicted)")
    adata_st.obs[measured.columns] = measured
    adata_st.obs[predicted.columns] = predicted
    columns = [c for pair in zip(measured.columns, predicted.columns, strict=True) for c in pair]
    sc.pl.spatial(adata_st, color=columns, ncols=2, frameon=False, vmin=0, vmax=1, cmap="inferno")
    adata_st.obs.drop(columns=columns, inplace=True)


plot_genes(["rragb", "trim17", "eno1b"])
plot_genes(['loc102633833', 'gm5700', 'gm8292'])
not measured in this version of the datasets, skipped: ['loc102633833', 'gm5700', 'gm8292']
plot_genes(['tfap2b', 'zic4', 'cd34', 'rasal1', 'gm33027', 'gm5431'])
Scores of all genes#
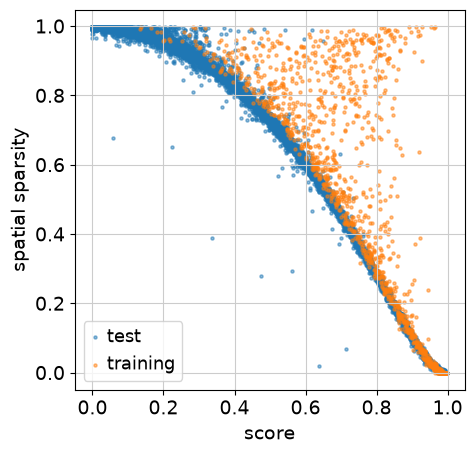
tg.compare_spatial_geneexp scores each gene by the cosine similarity of its measured and predicted expression
across spots, and plots it against how sparse the gene is in the section.
def scores(predicted):
    measured = adata_st[:, predicted.columns].to_df()
    norms = np.linalg.norm(measured, axis=0) * np.linalg.norm(predicted, axis=0)
    with np.errstate(invalid="ignore", divide="ignore"):
        return pd.Series((measured.to_numpy() * predicted.to_numpy()).sum(0) / norms, index=predicted.columns)


df_all_genes = pd.DataFrame(
    {
        "score": scores(adata_st.obsm["tangram"]),
        "sparsity_sp": 1 - np.asarray((adata_st[:, shared].X > 0).mean(0)).ravel(),
        "is_training": [g in training for g in shared],
    }
)
fig, ax = plt.subplots(figsize=(5, 5))
for is_training, group in df_all_genes.groupby("is_training"):
    ax.scatter(group.score, group.sparsity_sp, s=5, alpha=0.5, label="training" if is_training else "test")
ax.set(xlabel="score", ylabel="spatial sparsity")
ax.legend()
df_all_genes.groupby("is_training").score.describe()
| count | mean | std | min | 25% | 50% | 75% | max | |
|---|---|---|---|---|---|---|---|---|
| is_training | ||||||||
| False | 13505.0 | 0.458061 | 0.268343 | 0.000006 | 0.220106 | 0.455199 | 0.671241 | 0.998319 |
| True | 1280.0 | 0.737392 | 0.173196 | 0.134819 | 0.627000 | 0.756878 | 0.871339 | 0.997880 |
Against upstream#
Upstream Tangram from this repository’s pinned copy (vendor/Tangram), on the same reference, the same
marker-restricted section and the same settings, through squidpy_ports.tangram.upstream.run: the tutorial’s
pp_adatas → map_cells_to_space → project_genes. Each implementation draws its own random start, so the two
mappings differ in their details; the gene scores they reach are what should agree.
from squidpy_ports._common import Imputation
from squidpy_ports.tangram import upstream

test = [g for g in shared if g not in set(training)]
data = Imputation(
    ref=adata_sc[:, training + test].X.toarray(),
    query=adata_st[:, training].X.toarray(),
    truth=adata_st[:, test].X.toarray(),
    genes=training + test,
)
upstream_res = upstream.run(upstream.load(), data, num_epochs=500, density_prior="rna_count_based", random_state=0)
upstream_scores = scores(pd.DataFrame(upstream_res["imputed"], index=adata_st.obs_names, columns=test))

fig, ax = plt.subplots(figsize=(5, 5))
ax.scatter(upstream_scores, df_all_genes.score[test], s=5, alpha=0.5)
ax.axline((0, 0), slope=1, color="grey", lw=1)
ax.set(xlabel="upstream score", ylabel="squidpy score", title="test genes")
print(f"median test score: squidpy {df_all_genes.score[test].median():.3f}, upstream {upstream_scores.median():.3f}")
print(f"correlation of the per-gene scores: {np.corrcoef(upstream_scores.fillna(0), df_all_genes.score[test].fillna(0))[0, 1]:.3f}")
median test score: squidpy 0.455, upstream 0.455
correlation of the per-gene scores: 0.999