MERFISH onto Visium H&E, from annotated curves#
Landmarks traced as curves rather than clicked as points. A curve is a correspondence between two shapes, not between two lists of vertices, and that distinction is the whole content of this notebook.
Upstream’s own version of this notebook does not run. Its two saved curve files hold 10 and
15 vertices, so L_T_from_points raises Number of pointsI (10) is not equal to number of pointsJ (15) – and upstream’s committed output records that same exception. Squidpy raises
too, and for the same good reason: paired landmarks are matched by row, so unequal counts have
no meaning. The fix belongs to the caller, and it is to resample.
STalign’s own version of this analysis: merfish-visium-alignment-with-curve-annotator.
Inputs#
import matplotlib.pyplot as plt
import numpy as np, pandas as pd, spatialdata as sd
from spatialdata.models import Image2DModel, PointsModel
from spatialdata.transformations import get_transformation
from squidpy.experimental.im import rasterize_points
from squidpy.experimental.tl import stalign_align_image

# `sigmaM`, `sigmaB` and `sigmaA` are in the images' own intensity units, and upstream states
# its values for both sides mapped onto [0, 1]. A raw density raster of 167k cells has a mean
# near 3 and a max well above 10, which leaves widths of ~0.1 about a hundred times too tight:
# the fit then converges on an objective that has stopped measuring the overlap.
def unit(a):
    a = np.asarray(a, dtype=float)
    return (a - a.min()) / np.ptp(a)

def as_image(rgb, key):
    return sd.SpatialData(images={key: Image2DModel.parse(
        unit(np.moveaxis(rgb, -1, 0)), dims=('c', 'y', 'x'))})

def rasterized(xy, dx):
    sdata = sd.SpatialData(points={'cells': PointsModel.parse(xy)})
    rasterize_points(sdata, points_key='cells', dx=dx, blur=1.0, key_added='section')
    element = sdata.images['section']
    sdata.images['section'] = Image2DModel.parse(
        unit(np.asarray(element)), dims=('c', 'y', 'x'),
        transformations={'global': get_transformation(element, 'global')})
    return sdata

MERFISH = ('merfish_data/datasets_mouse_brain_map_BrainReceptorShowcase'
           '_Slice2_Replicate3_cell_metadata_S2R3.csv.gz')
cells = pd.read_csv(MERFISH)
xy = np.c_[cells['center_x'], cells['center_y']].astype(float)

he = plt.imread('visium_data/tissue_hires_image.png')[..., :3]
visium = as_image(he, 'he')
merfish = rasterized(xy, 30.0)

traced = {side: np.load(f'visium_data/{name}_curves.npy', allow_pickle=True).item()
          for side, name in (('query', 'Merfish_S2_R3'), ('ref', 'tissue_hires_image'))}
for name in traced['ref']:
    print(f'{name:<8} ref {len(traced["ref"][name]):>3} vertices, '
          f'query {len(traced["query"][name]):>3}')
first    ref   2 vertices, query   2
second   ref   2 vertices, query   2
third    ref  11 vertices, query   6
Resampling the curves#
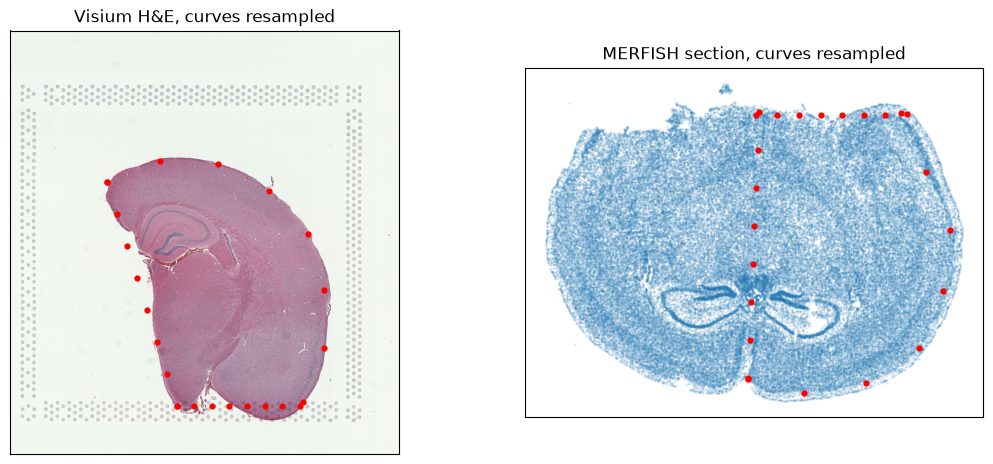
Each curve is resampled to the same number of points, evenly along its own arc length. That is what makes the two sides comparable: vertex k of one curve then corresponds to vertex k of the other because both are the same fraction along the shape, which is not true of whatever vertex count the annotator happened to record.
def resampled(curve, n):
    points = np.asarray(curve, dtype=float)
    walked = np.r_[0.0, np.cumsum(np.linalg.norm(np.diff(points, axis=0), axis=1))]
    even = np.linspace(0.0, walked[-1], n)
    return np.c_[np.interp(even, walked, points[:, 0]), np.interp(even, walked, points[:, 1])]

PER_CURVE = 8
paired = {side: np.vstack([resampled(traced[side][name], PER_CURVE) for name in traced['ref']])
          for side in traced}
print(f'{len(paired["ref"])} pairs from {len(traced["ref"])} curves at {PER_CURVE} points each')

fig, ax = plt.subplots(1, 2, figsize=(13, 5.5))
ax[0].imshow(he); ax[0].scatter(*paired['ref'].T, s=12, c='red')
ax[0].set_title('Visium H&E, curves resampled')
ax[1].scatter(*xy.T, s=0.12, alpha=0.3); ax[1].scatter(*paired['query'].T, s=12, c='red')
ax[1].set_title('MERFISH section, curves resampled')
ax[1].invert_yaxis(); ax[1].set_aspect('equal')
for a in ax:
    a.set_xticks([]); a.set_yticks([])
24 pairs from 3 curves at 8 points each
The fit#
fit = stalign_align_image(
    visium, merfish, image_key=('he', 'section'),
    landmarks_ref=paired['ref'], landmarks_query=paired['query'],
    niter=200, sigmaM=0.18, sigmaB=0.18, sigmaA=0.18, sigmaP=2e-1,
    epL=5e-11, epT=5e-4, epV=5e1,
)
print(f'{fit.n_iter} iterations, objective '
      f'{float(fit.energies[0]):.0f} -> {float(fit.energies[-1]):.0f}')
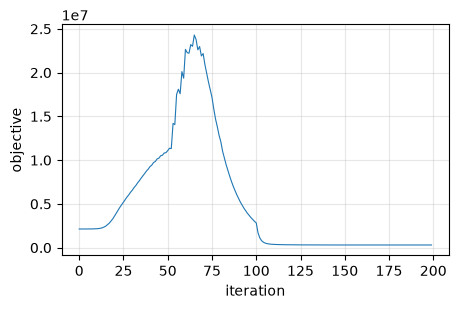
200 iterations, objective 2132960 -> 306895
Every cell, placed on the image#
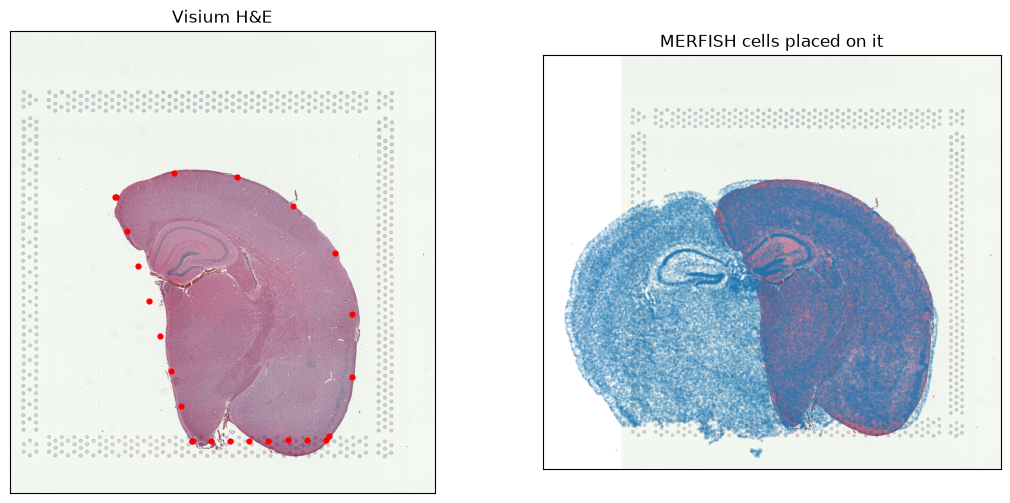
placed = np.asarray(fit.transform_points(xy))
residual = np.linalg.norm(np.asarray(fit.transform_points(paired['query'])) - paired['ref'], axis=1)
rows, columns = he.shape[:2]
inside = ((placed[:, 0] >= 0) & (placed[:, 0] < columns)
          & (placed[:, 1] >= 0) & (placed[:, 1] < rows))
print(f'landmark residual: median {np.median(residual):.1f} px, worst {residual.max():.1f} px')
print(f'{100 * inside.mean():.0f}% of cells land within the {columns} x {rows} image')

fig, ax = plt.subplots(1, 2, figsize=(13, 6))
ax[0].imshow(he); ax[0].scatter(*paired['ref'].T, s=12, c='red')
ax[0].set_title('Visium H&E')
ax[1].imshow(he); ax[1].scatter(*placed.T, s=0.12, alpha=0.3, c='tab:blue')
ax[1].set_title('MERFISH cells placed on it')
for a in ax:
    a.set_xticks([]); a.set_yticks([])
landmark residual: median 0.4 px, worst 3.4 px
90% of cells land within the 1838 x 2000 image
Convergence#
energies = np.asarray(fit.energies)[: fit.n_iter]
plt.figure(figsize=(5, 3))
plt.plot(energies, lw=0.8)
plt.xlabel('iteration'); plt.ylabel('objective'); plt.grid(alpha=0.3)