Hematopoiesis - DPT#
Construct diffusion pseudotime on NeurIPS 2021 hematopoiesis data.
import sys

import numpy as np
import pandas as pd

import matplotlib.pyplot as plt
import mplscience
import seaborn as sns

import cellrank as cr
import scanpy as sc
import scvelo as scv
from anndata import AnnData

from cr2 import get_state_purity, plot_state_purity, running_in_notebook

sys.path.extend(["../../../", "."])
from paths import DATA_DIR, FIG_DIR  # isort: skip  # noqa: E402
Global seed set to 0
General settings#
sc.settings.verbosity = 2
cr.settings.verbosity = 4
scv.settings.verbosity = 3
scv.settings.set_figure_params("scvelo", dpi_save=400, dpi=80, transparent=True, fontsize=20, color_map="viridis")
SAVE_FIGURES = False
if SAVE_FIGURES:
    (FIG_DIR / "pseudotime_kernel" / "hematopoiesis").mkdir(parents=True, exist_ok=True)

FIGURE_FORMAT = "pdf"
(DATA_DIR / "hematopoiesis" / "results").mkdir(parents=True, exist_ok=True)
Constants#
CELLTYPES_TO_KEEP = [
    "HSC",
    "MK/E prog",
    "Proerythroblast",
    "Erythroblast",
    "Normoblast",
    "cDC2",
    "pDC",
    "G/M prog",
    "CD14+ Mono",
]
Data loading#
adata = sc.read(DATA_DIR / "hematopoiesis" / "processed" / "gex_preprocessed.h5ad")
adata
AnnData object with n_obs × n_vars = 67568 × 25629
    obs: 'site', 'donor', 'batch', 'l1_cell_type', 'l2_cell_type'
    var: 'hvg_multiVI'
    uns: 'neighbors', 'umap'
    obsm: 'MultiVI_latent', 'X_umap'
    layers: 'counts'
    obsp: 'connectivities', 'distances'
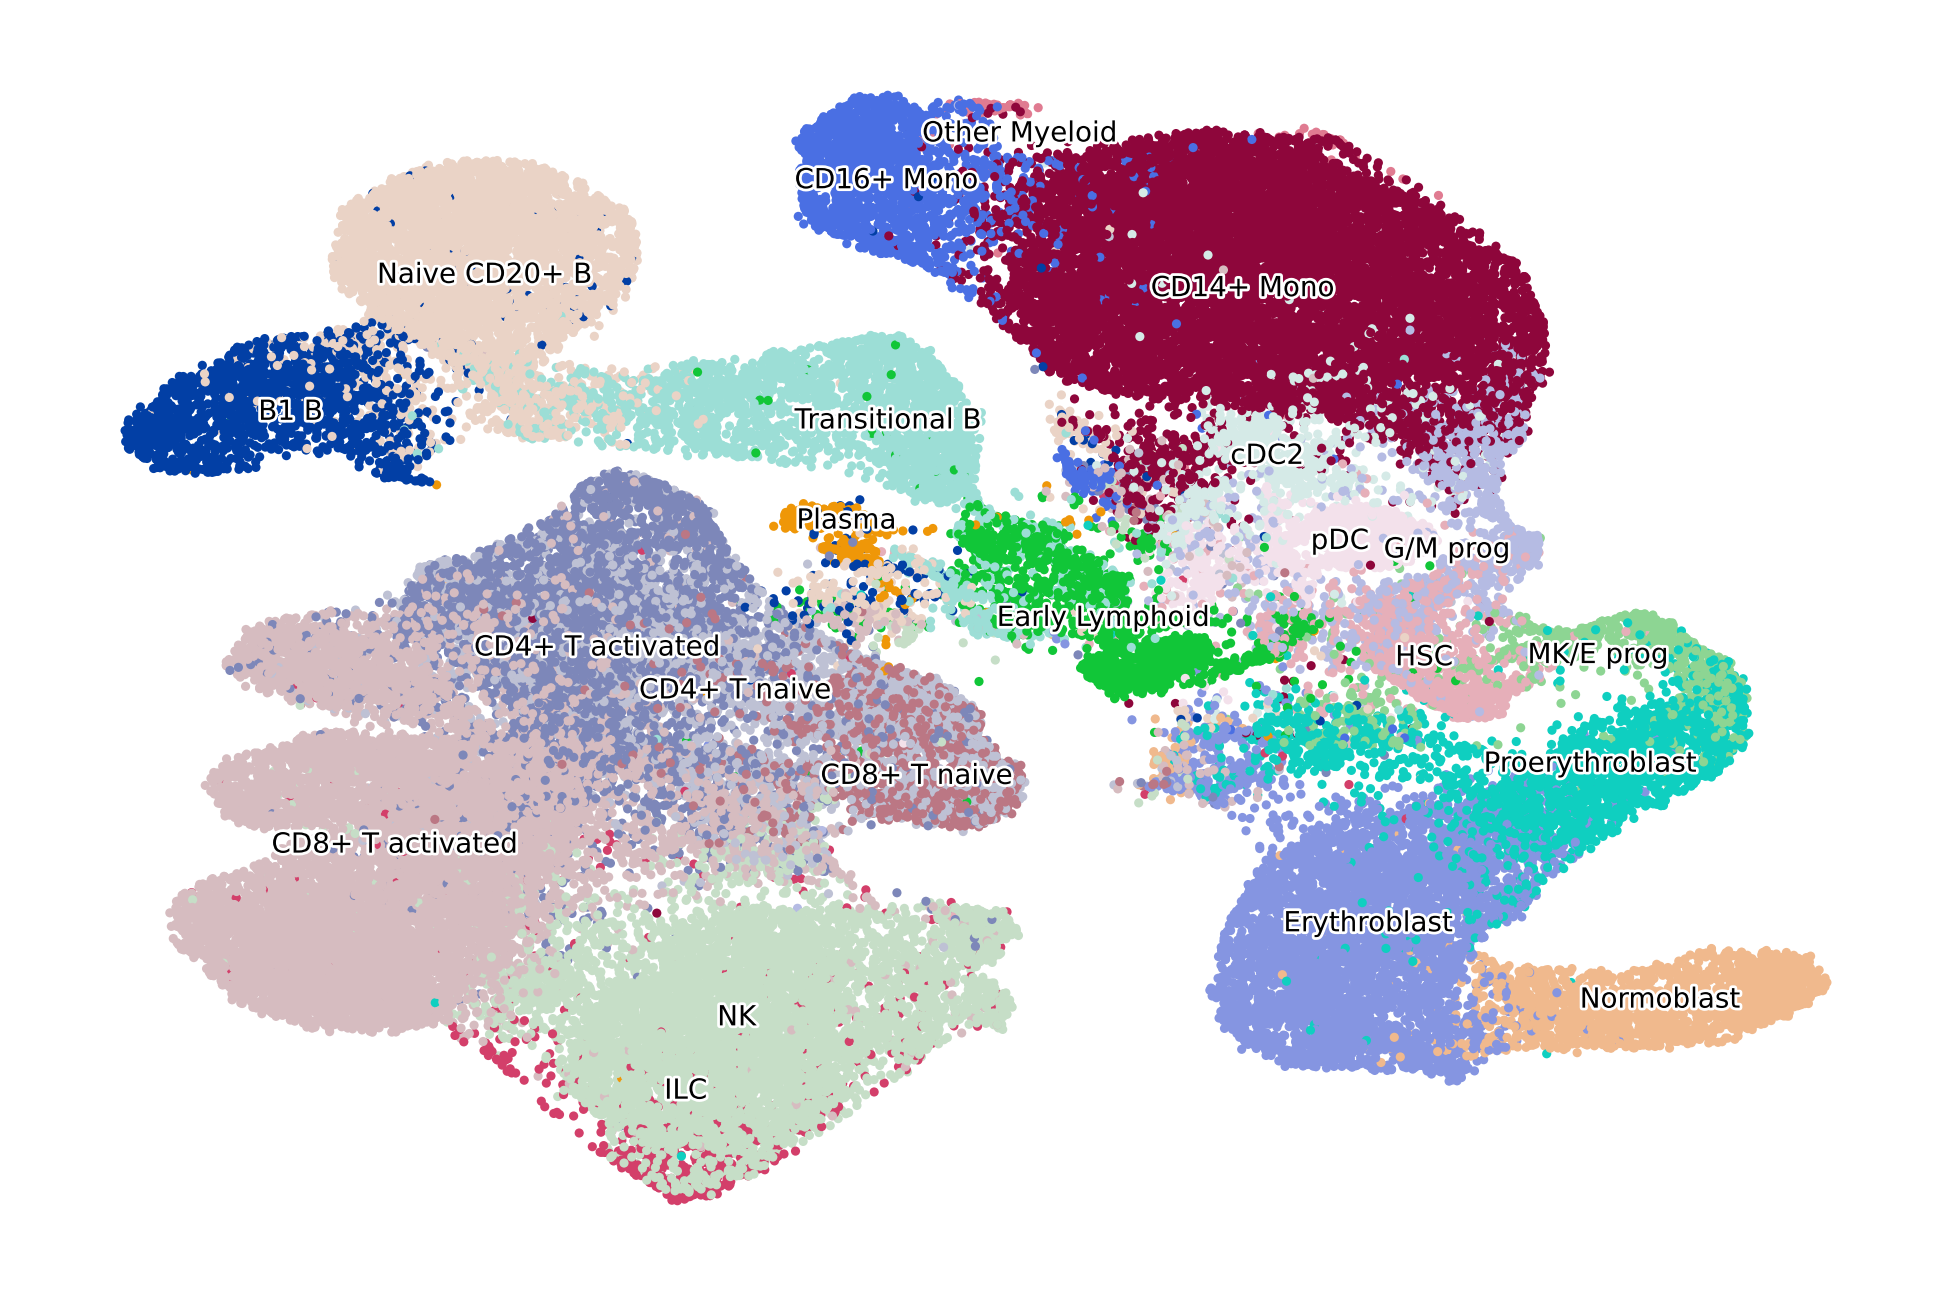
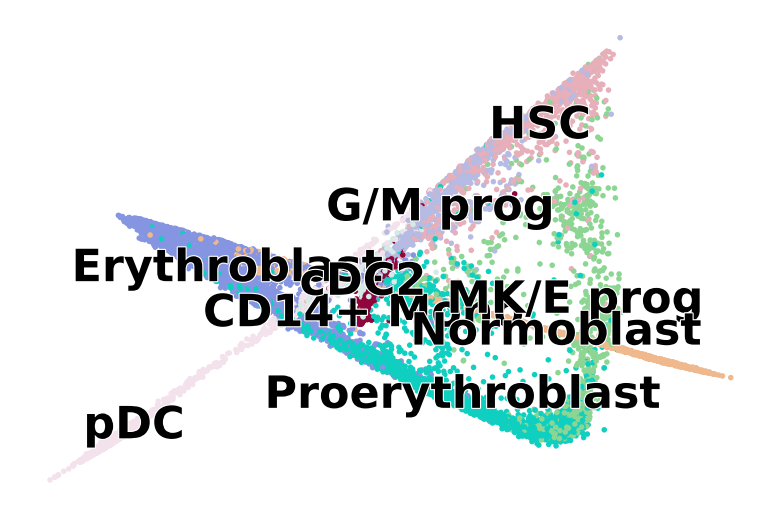
if running_in_notebook():
    scv.pl.scatter(adata, basis="X_umap", c="l2_cell_type", dpi=200, title="", legend_fontsize=5, legend_fontweight=1)

if SAVE_FIGURES:
    fig, ax = plt.subplots(figsize=(6, 4))

    scv.pl.scatter(adata, basis="X_umap", c="l2_cell_type", legend_loc="none", title="", ax=ax)

    fig.savefig(
        FIG_DIR / "pseudotime_kernel" / "hematopoiesis" / f"umap_colored_by_l2_cell_type_full_data.{FIGURE_FORMAT}",
        format=FIGURE_FORMAT,
        transparent=True,
        bbox_inches="tight",
    )
Data preprocessing#
adata = adata[adata.obs["l2_cell_type"].isin(CELLTYPES_TO_KEEP), :].copy()
adata
AnnData object with n_obs × n_vars = 24440 × 25629
    obs: 'site', 'donor', 'batch', 'l1_cell_type', 'l2_cell_type'
    var: 'hvg_multiVI'
    uns: 'neighbors', 'umap', 'l2_cell_type_colors'
    obsm: 'MultiVI_latent', 'X_umap'
    layers: 'counts'
    obsp: 'connectivities', 'distances'
sc.pp.neighbors(adata, use_rep="MultiVI_latent")
sc.tl.umap(adata)
computing neighbors
    finished (0:02:29)
computing UMAP
    finished (0:00:12)
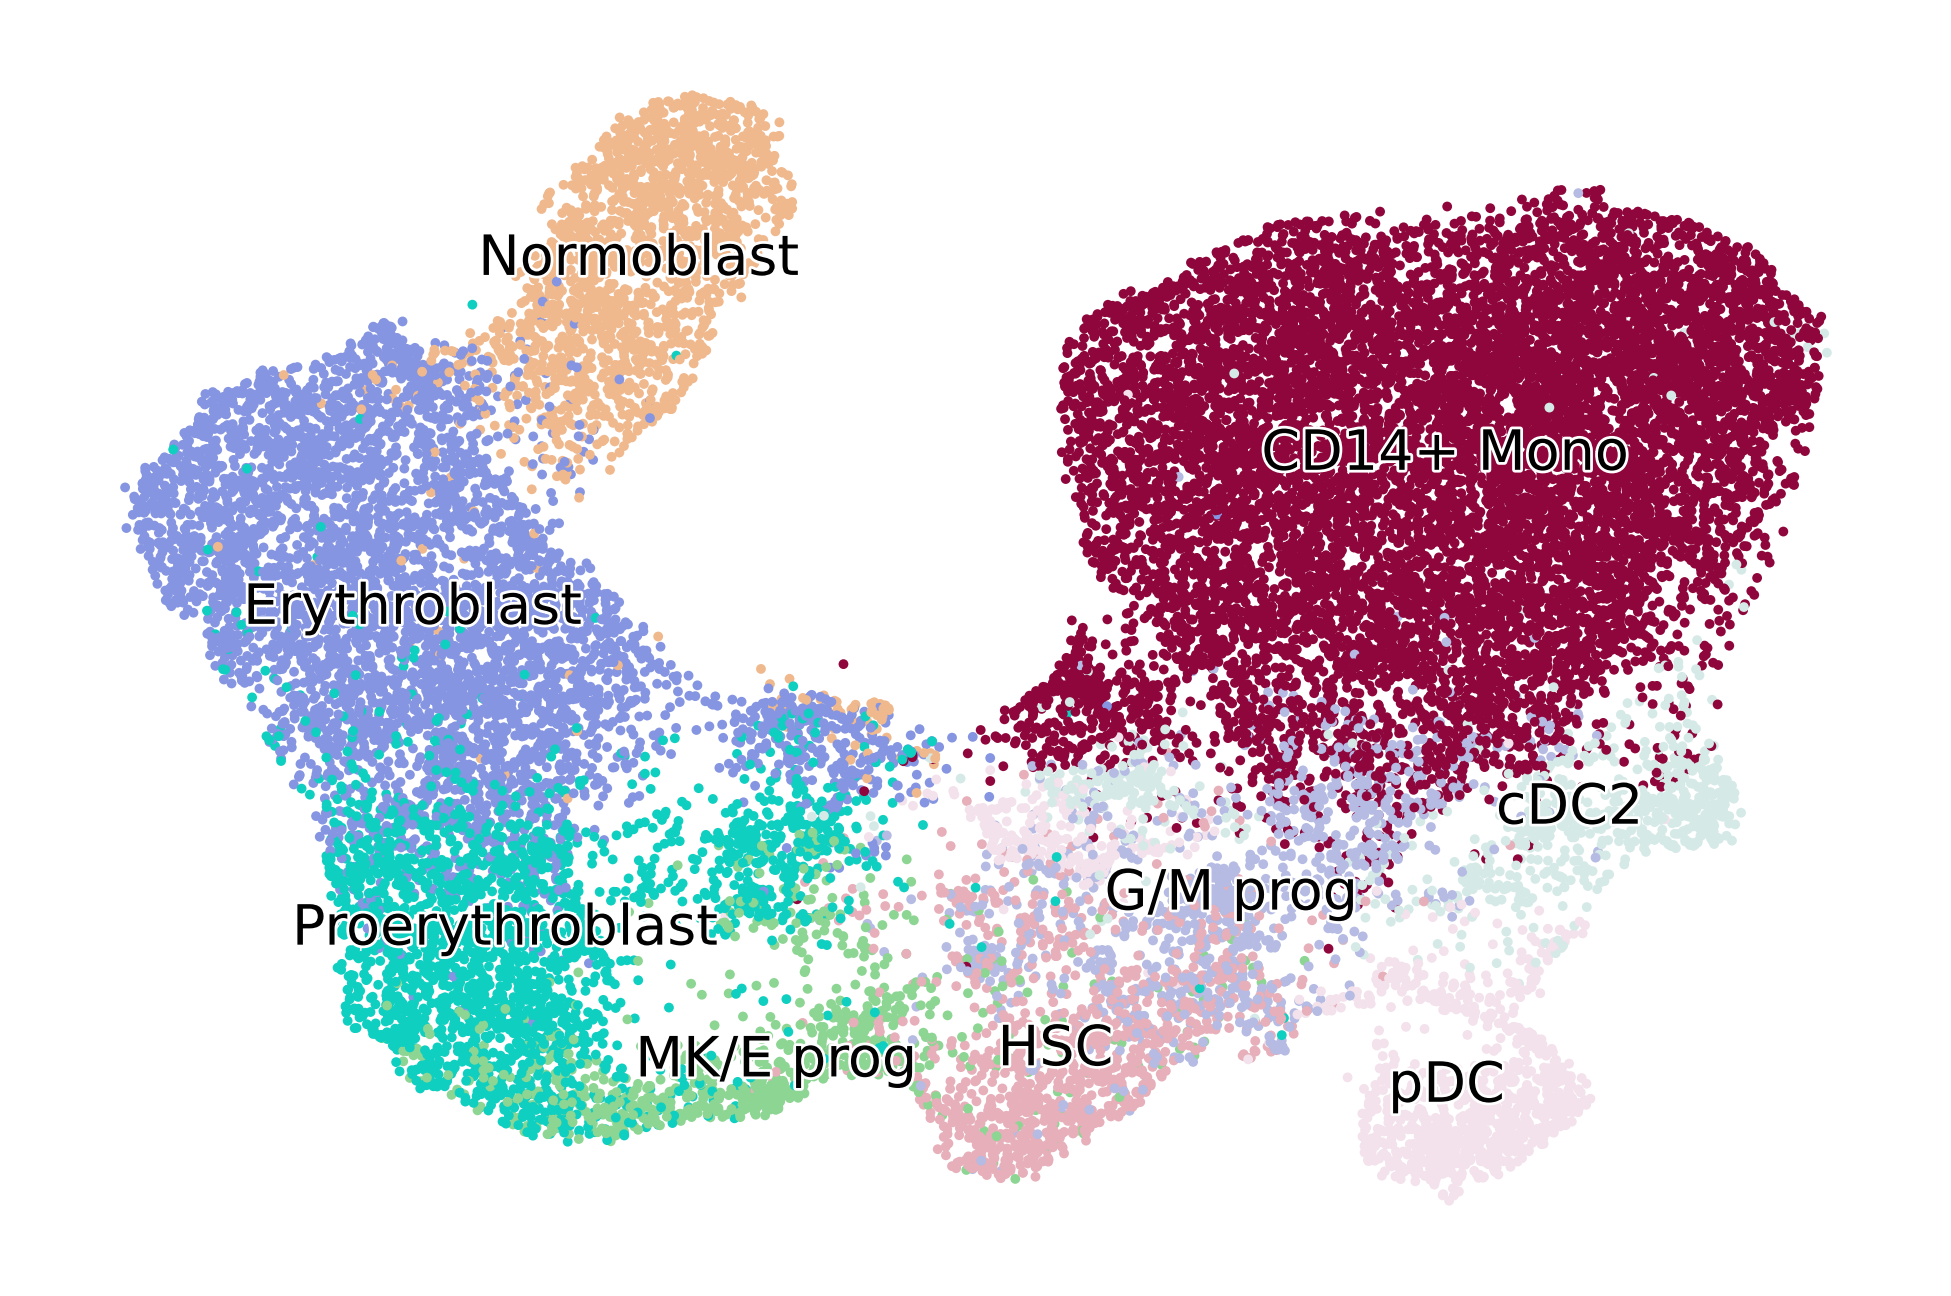
if running_in_notebook():
    scv.pl.scatter(
        adata,
        basis="X_umap",
        c="l2_cell_type",
        dpi=200,
        title="",
        legend_fontsize=10,
        legend_fontweight=5,
    )

if SAVE_FIGURES:
    fig, ax = plt.subplots(figsize=(6, 4))
    scv.pl.scatter(adata, basis="X_umap", c="l2_cell_type", legend_loc="none", title="", ax=ax)

    fig.savefig(
        FIG_DIR
        / "pseudotime_kernel"
        / "hematopoiesis"
        / f"umap_colored_by_l2_cell_type_subsetted_data.{FIGURE_FORMAT}",
        format=FIGURE_FORMAT,
        transparent=True,
        bbox_inches="tight",
    )
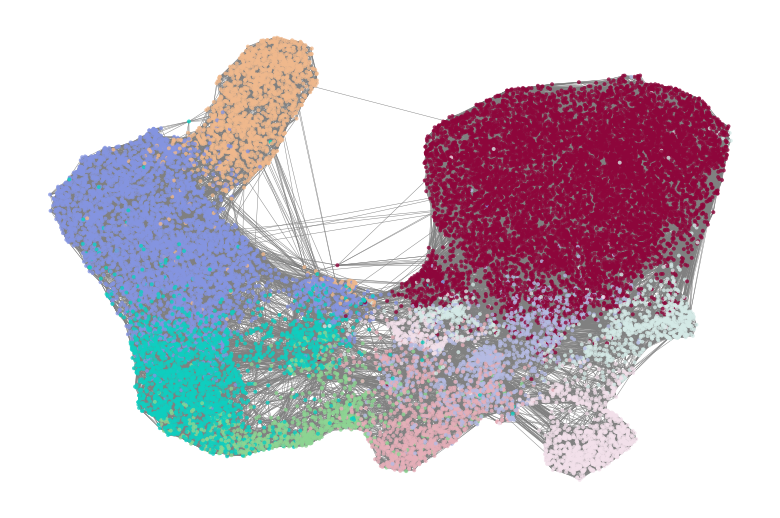
if running_in_notebook():
    fig, ax = plt.subplots(figsize=(6, 4))
    scv.pl.velocity_graph(
        adata, basis="umap", which_graph="connectivities", color="l2_cell_type", legend_loc=False, title="", ax=ax
    )

if SAVE_FIGURES:
    fig.savefig(
        FIG_DIR / "pseudotime_kernel" / "hematopoiesis" / f"umap_with_knn_graph.{FIGURE_FORMAT}",
        format=FIGURE_FORMAT,
        transparent=True,
        bbox_inches="tight",
        dpi=400,
    )
Diffusion pseudotime#
sc.tl.diffmap(adata, n_comps=15)
computing Diffusion Maps using n_comps=15(=n_dcs)
computing transitions
    finished (0:00:00)
    eigenvalues of transition matrix
    [1.         0.99922997 0.9977195  0.9968419  0.9955766  0.9942717
     0.9900949  0.9884704  0.9867782  0.9852537  0.9849594  0.9830871
     0.98229724 0.9809607  0.97756666]
    finished (0:00:02)
if running_in_notebook():
    fig, ax = plt.subplots(figsize=(6, 4))
    scv.pl.scatter(
        adata, basis="diffmap", color=["l2_cell_type"], components=["4, 5"], size=25, dpi=100, title="", ax=ax
    )

    if SAVE_FIGURES:
        fig, ax = plt.subplots(figsize=(6, 4))
        scv.pl.scatter(
            adata, basis="diffmap", color=["l2_cell_type"], components=["4, 5"], title="", legend_loc=False, ax=ax
        )

        fig.savefig(
            FIG_DIR / "pseudotime_kernel" / "hematopoiesis" / f"diffmap_dc4_vs_dc5_colored_by_celltype.{FIGURE_FORMAT}",
            format=FIGURE_FORMAT,
            transparent=True,
            bbox_inches="tight",
        )
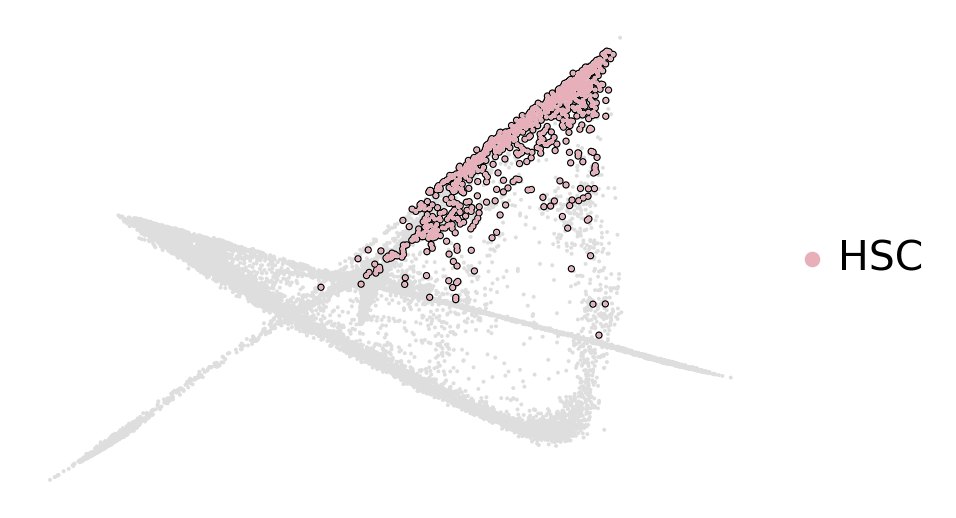
adata.obs["hsc_cluster"] = (
    adata.obs["l2_cell_type"]
    .astype("str")
    .replace(
        {
            "MK/E prog": "nan",
            "Proerythroblast": "nan",
            "Erythroblast": "nan",
            "Normoblast": "nan",
            "cDC2": "nan",
            "pDC": "nan",
            "G/M prog": "nan",
            "CD14+ Mono": "nan",
        }
    )
    .astype("category")
    .cat.reorder_categories(["nan", "HSC"])
    .copy()
)

celltype_colors = dict(zip(adata.obs["l2_cell_type"].cat.categories, adata.uns["l2_cell_type_colors"]))
adata.uns["hsc_cluster_colors"] = ["#dedede", celltype_colors["HSC"]]

if running_in_notebook():
    fig, ax = plt.subplots(figsize=(6, 4))
    scv.pl.scatter(
        adata,
        basis="diffmap",
        c=["hsc_cluster"],
        legend_loc="right",
        components=["4, 5"],
        add_outline="HSC",
        title="",
        ax=ax,
    )

if SAVE_FIGURES:
    fig, ax = plt.subplots(figsize=(6, 4))
    scv.pl.scatter(
        adata,
        basis="diffmap",
        c=["hsc_cluster"],
        legend_loc=False,
        components=["4, 5"],
        add_outline="HSC",
        title="",
        ax=ax,
    )

    fig.savefig(
        FIG_DIR / "pseudotime_kernel" / "hematopoiesis" / f"diffmap_dc4_vs_dc5_hsc_outlined.{FIGURE_FORMAT}",
        format=FIGURE_FORMAT,
        transparent=True,
        bbox_inches="tight",
        dpi=400,
    )
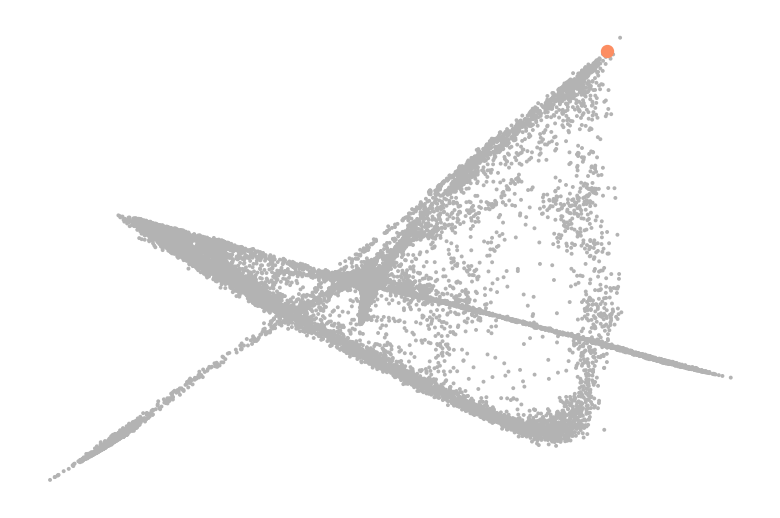
df = (
    pd.DataFrame(
        {
            "diff_comp": adata.obsm["X_diffmap"][:, 5],
            "cell_type": adata.obs["l2_cell_type"].values,
        }
    )
    .reset_index()
    .rename({"index": "obs_id"}, axis=1)
)
df = df.loc[df["cell_type"] == "HSC", "diff_comp"]
root_idx = df.index[df.argmax()]

set2_cmap = sns.color_palette("Set2").as_hex()
palette = [set2_cmap[-1], set2_cmap[1]]

if running_in_notebook():
    fig, ax = plt.subplots(figsize=(6, 4))
    scv.pl.scatter(adata, basis="diffmap", c=root_idx, legend_loc=False, palette=palette, components=["4, 5"], ax=ax)

    if SAVE_FIGURES:
        fig.savefig(
            FIG_DIR / "pseudotime_kernel" / "hematopoiesis" / f"diffmap_dc4_vs_dc5_pseudotime_root_id.{FIGURE_FORMAT}",
            format=FIGURE_FORMAT,
            transparent=True,
            bbox_inches="tight",
        )
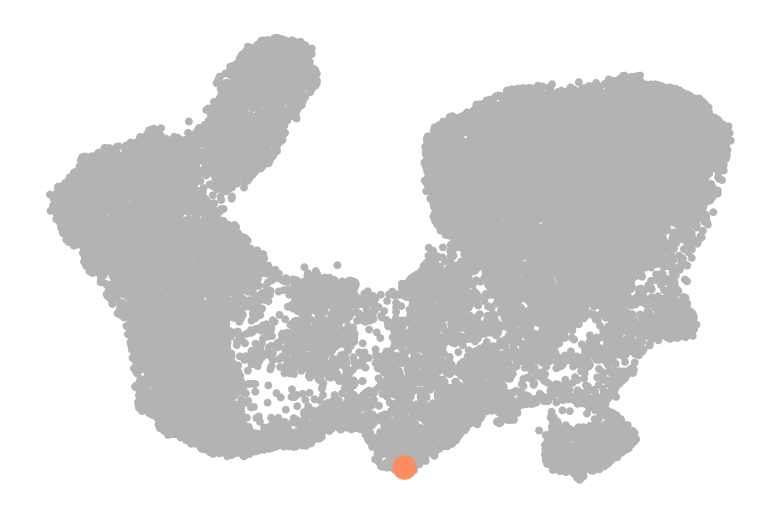
adata.uns["iroot"] = root_idx
sc.tl.dpt(adata, n_dcs=6)
computing Diffusion Pseudotime using n_dcs=6
    finished (0:00:00)
if running_in_notebook():
    fig, ax = plt.subplots(figsize=(6, 4))
    scv.pl.scatter(adata, basis="umap", color=root_idx, palette=palette, color_map="viridis", size=50, ax=ax)

    if SAVE_FIGURES:
        fig.savefig(
            FIG_DIR / "pseudotime_kernel" / "hematopoiesis" / f"umap_pseudotime_root_id.{FIGURE_FORMAT}",
            format=FIGURE_FORMAT,
            transparent=True,
            bbox_inches="tight",
        )
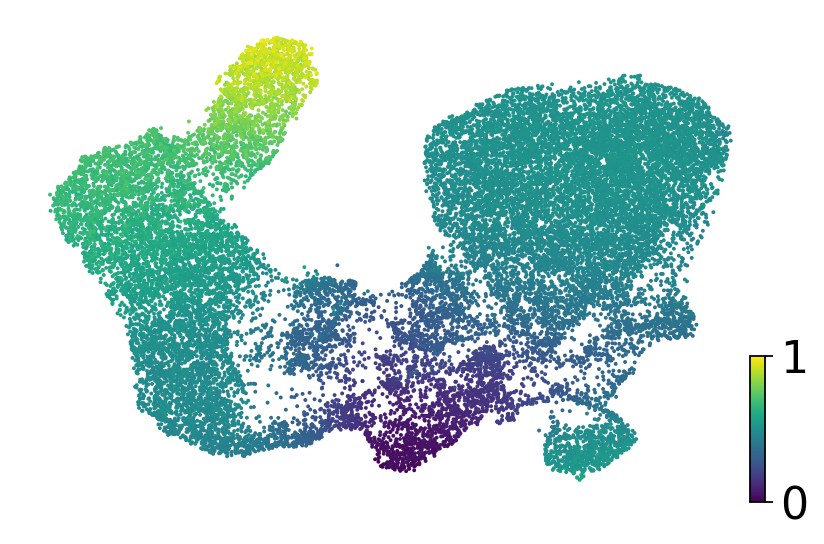
if running_in_notebook():
    fig, ax = plt.subplots(figsize=(6, 4))
    scv.pl.scatter(adata, basis="umap", color="dpt_pseudotime", title="", color_map="viridis", ax=ax)

if SAVE_FIGURES:
    fig, ax = plt.subplots(figsize=(6, 4))
    scv.pl.scatter(adata, basis="umap", color="dpt_pseudotime", title="", color_map="viridis", colorbar=False, ax=ax)

    fig.savefig(
        FIG_DIR / "pseudotime_kernel" / "hematopoiesis" / f"umap_colored_by_dpt_pseudotime.{FIGURE_FORMAT}",
        format=FIGURE_FORMAT,
        transparent=True,
        bbox_inches="tight",
    )
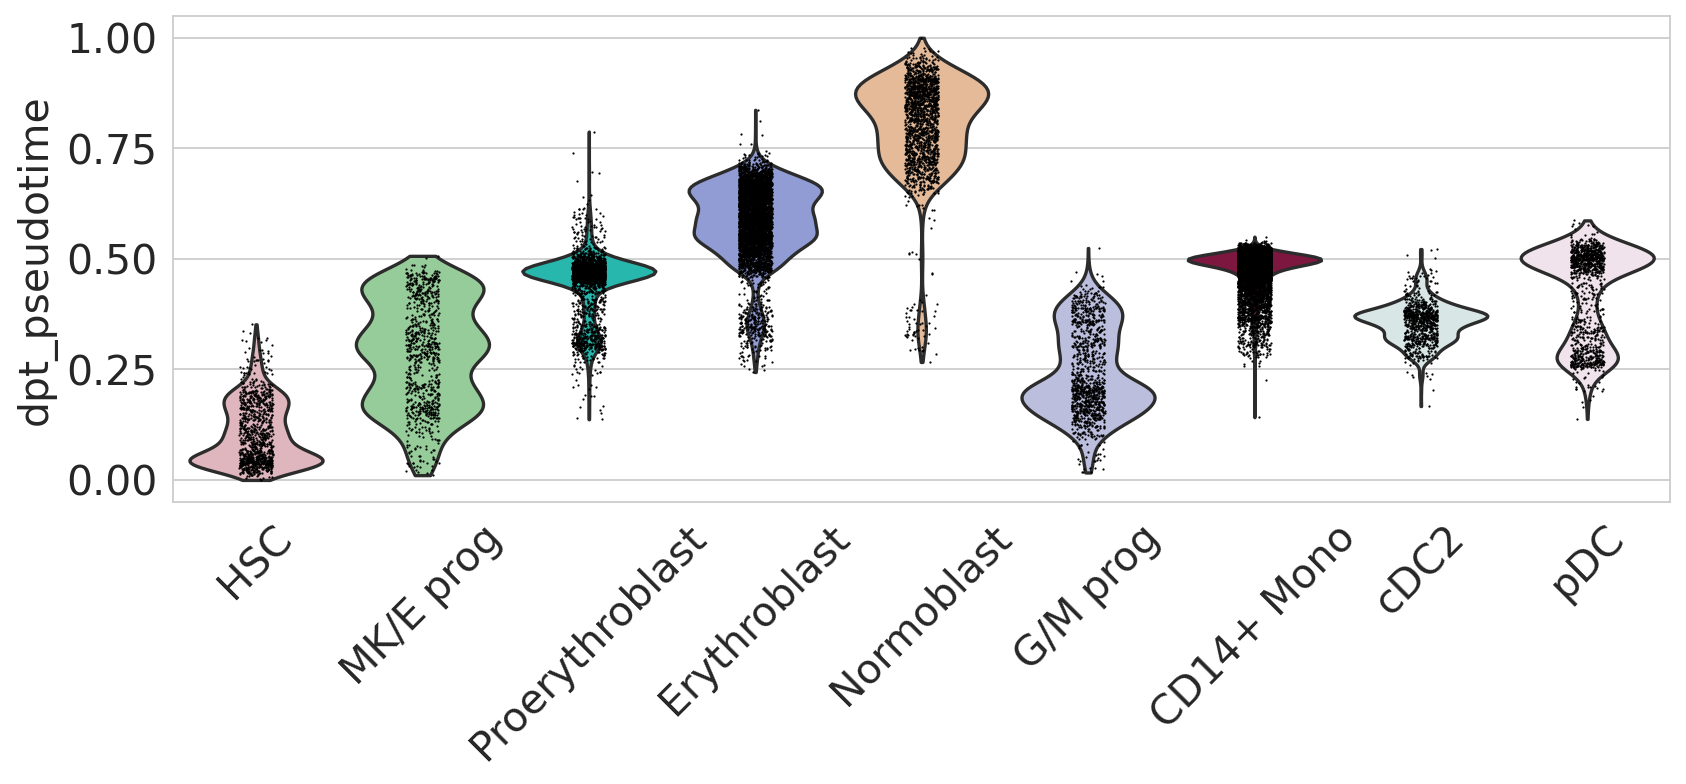
if running_in_notebook():
    sns.set_style(style="whitegrid")
    fig, ax = plt.subplots(figsize=(12, 4))
    sc.pl.violin(
        adata,
        keys=["dpt_pseudotime"],
        groupby="l2_cell_type",
        rotation=45,
        title="",
        legend_loc="none",
        order=[
            "HSC",
            "MK/E prog",
            "Proerythroblast",
            "Erythroblast",
            "Normoblast",
            "G/M prog",
            "CD14+ Mono",
            "cDC2",
            "pDC",
        ],
        ax=ax,
    )

    sns.reset_orig()

if SAVE_FIGURES:
    sns.set_style(style="whitegrid")
    fig, ax = plt.subplots(figsize=(12, 4))
    sc.pl.violin(
        adata,
        keys=["dpt_pseudotime"],
        groupby="l2_cell_type",
        rotation=45,
        title="",
        legend_loc="none",
        order=[
            "HSC",
            "MK/E prog",
            "Proerythroblast",
            "Erythroblast",
            "Normoblast",
            "G/M prog",
            "CD14+ Mono",
            "cDC2",
            "pDC",
        ],
        ax=ax,
    )
    ax.set(xlabel=None, xticklabels=[], ylabel=None, yticklabels=[])

    sns.reset_orig()

    fig.savefig(
        FIG_DIR / "pseudotime_kernel" / "hematopoiesis" / f"dpt_per_cell_type.{FIGURE_FORMAT}",
        format=FIGURE_FORMAT,
        transparent=True,
        bbox_inches="tight",
    )
CellRank#
Kernel#
ptk = cr.kernels.PseudotimeKernel(adata, time_key="dpt_pseudotime").compute_transition_matrix(threshold_scheme="soft")
Computing transition matrix based on pseudotime
Finish (0:00:10)
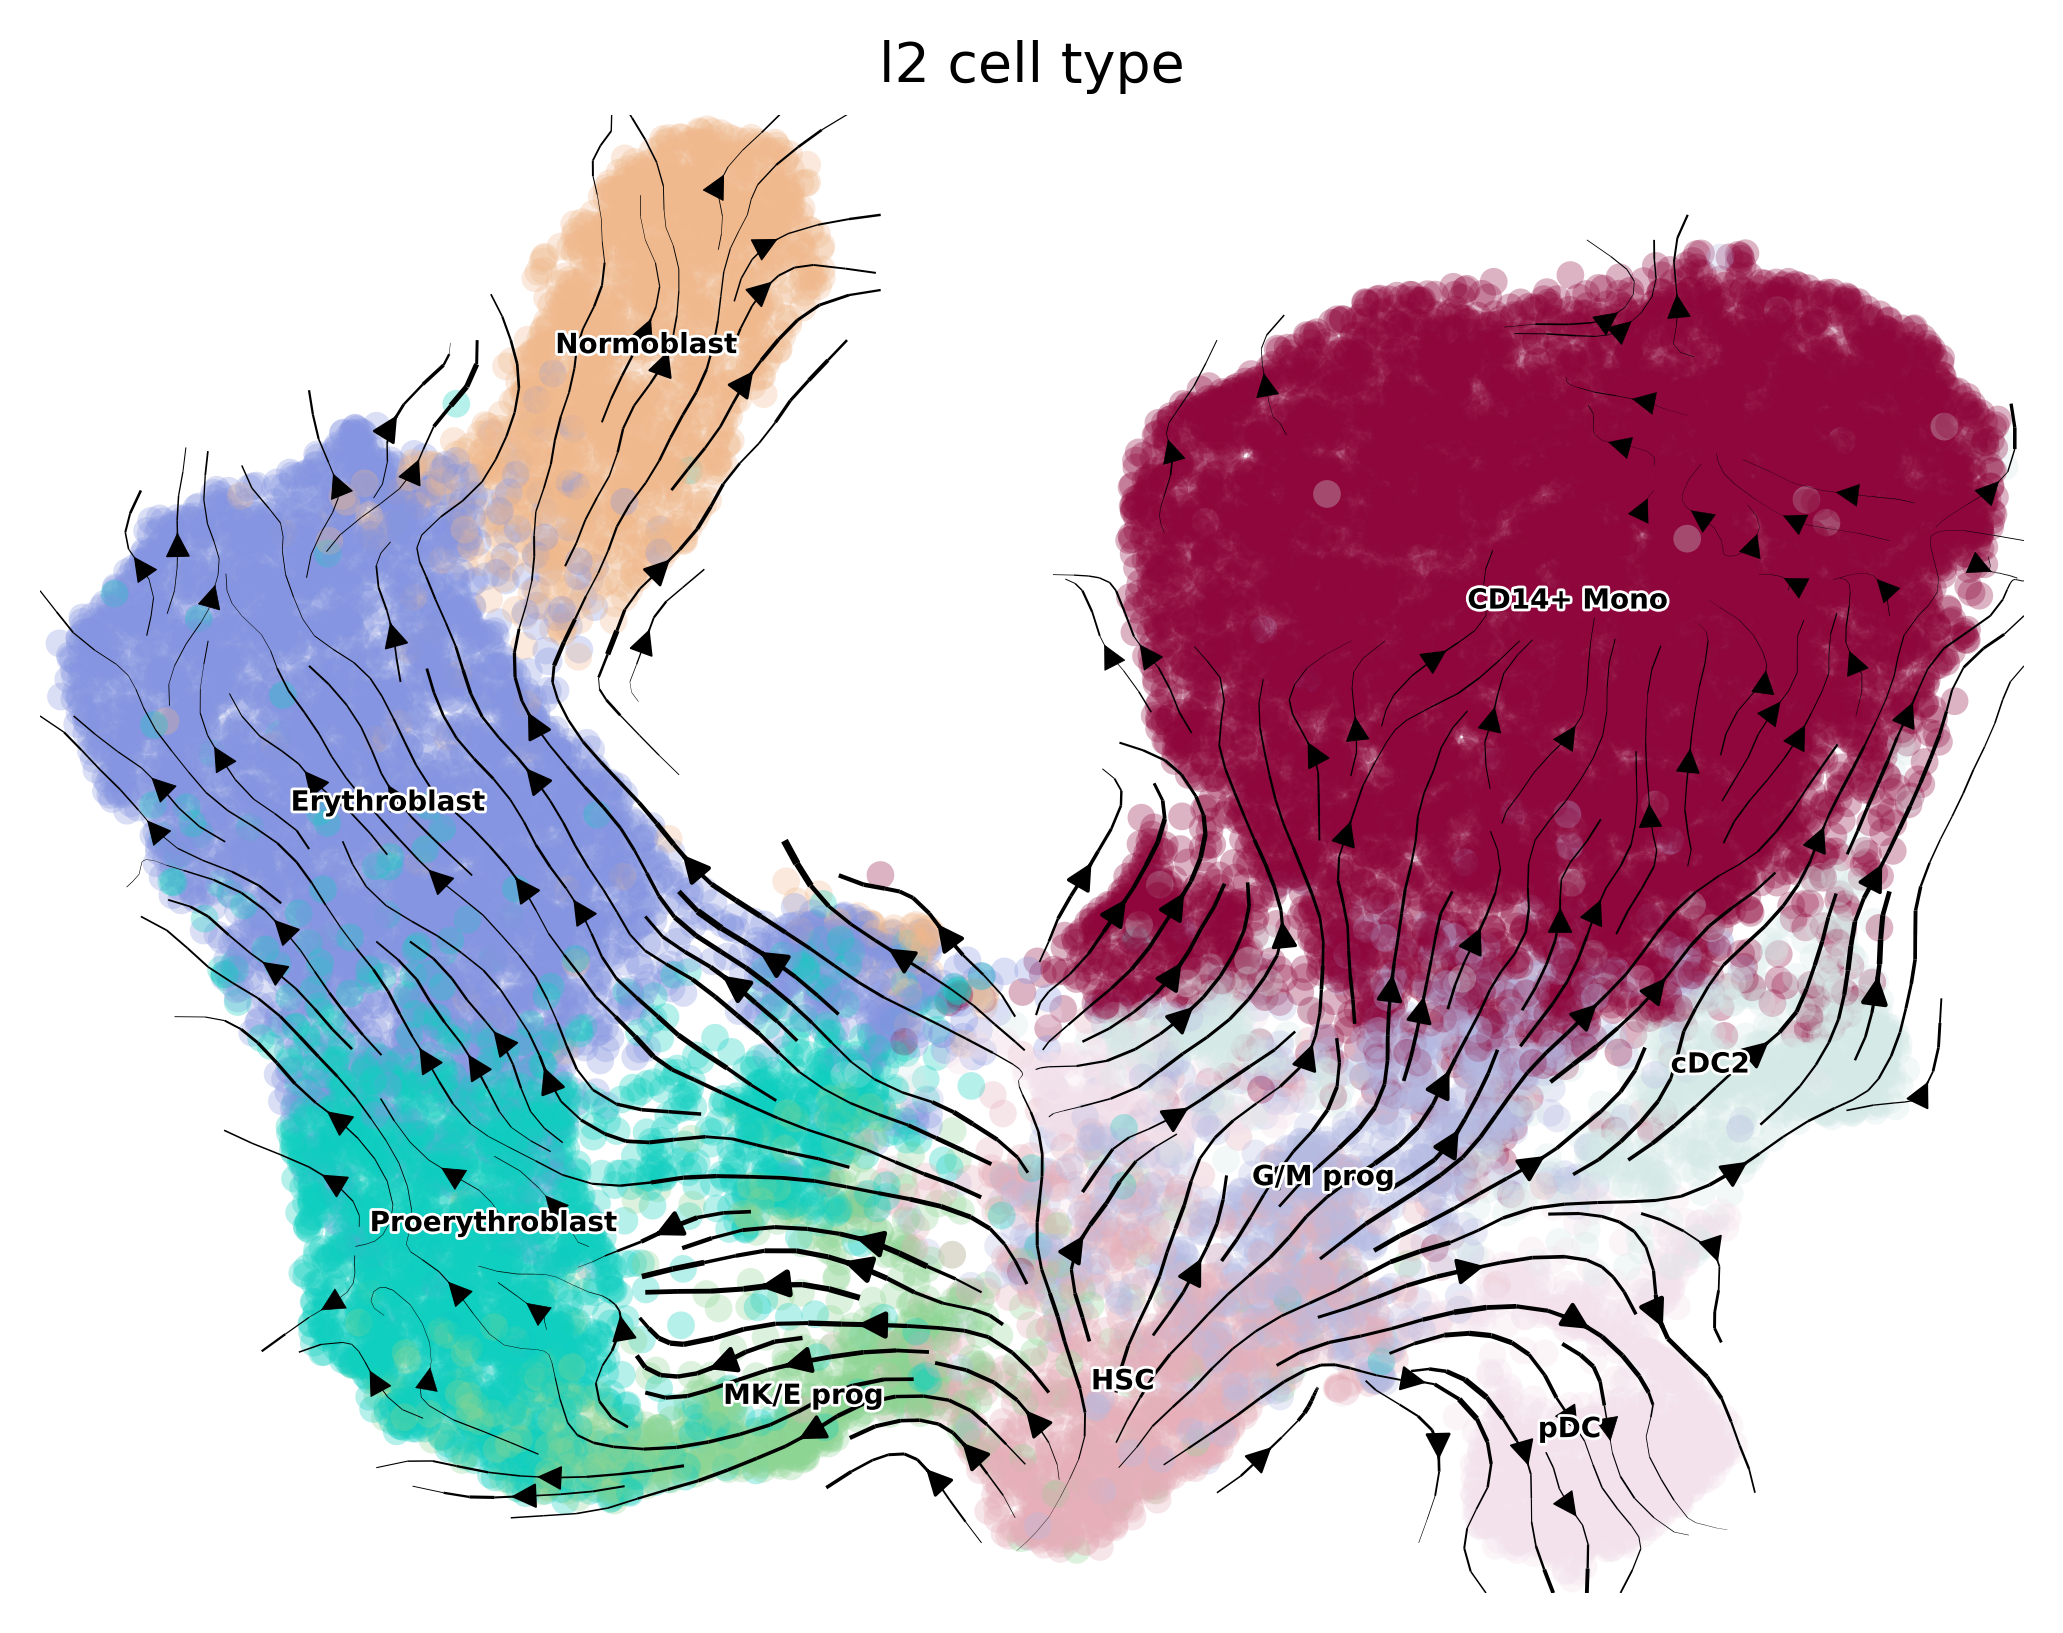
if running_in_notebook():
    ptk.plot_projection(color="l2_cell_type", recompute=True, basis="X_umap", dpi=200, legend_fontsize=5)

    if SAVE_FIGURES:
        fig, ax = plt.subplots(figsize=(6, 4))
        ptk.plot_projection(
            color="l2_cell_type",
            recompute=True,
            basis="X_umap",
            title="",
            legend_loc="none",
            alpha=0.25,
            linewidth=2,
            ax=ax,
        )

        fig.savefig(
            FIG_DIR / "pseudotime_kernel" / "hematopoiesis" / f"dpt_stream.{FIGURE_FORMAT}",
            format=FIGURE_FORMAT,
            transparent=True,
            bbox_inches="tight",
            dpi=400,
        )
Projecting transition matrix onto `umap`
Adding `adata.obsm['T_fwd_umap']`
    Finish (0:00:07)
Estimator#
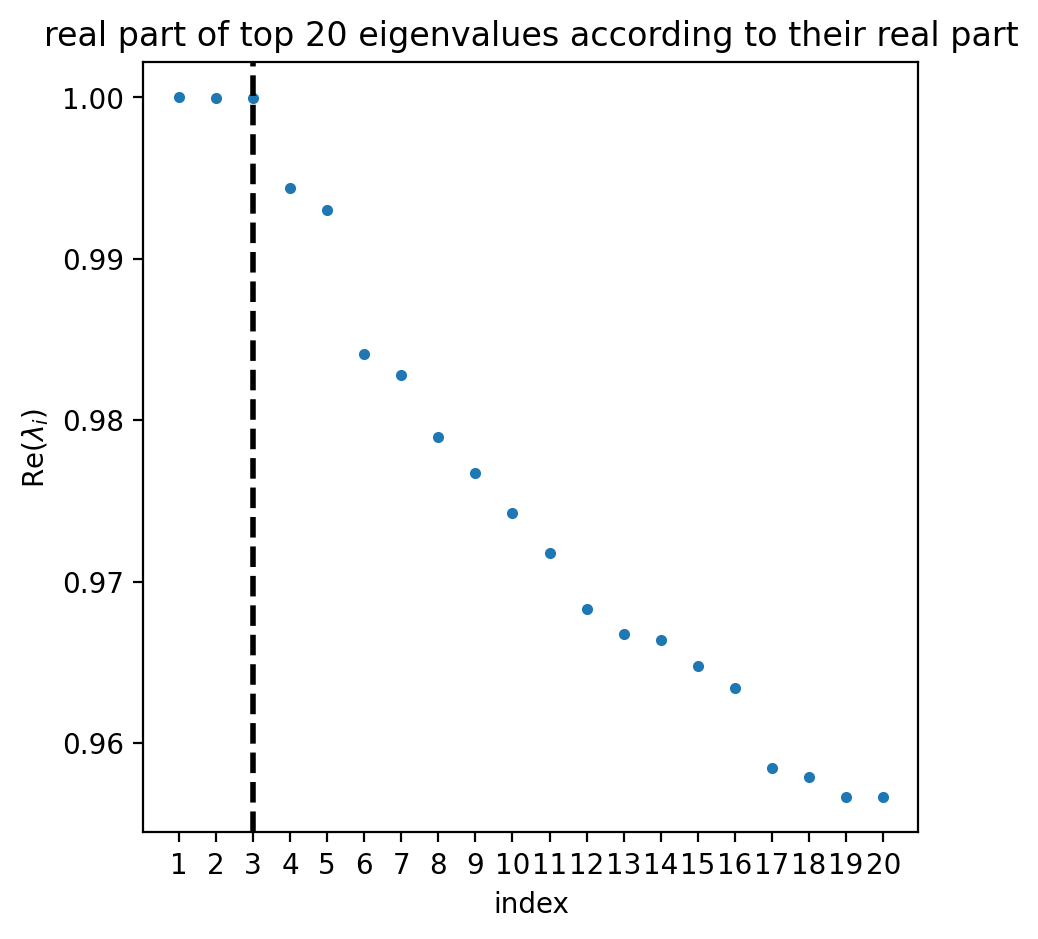
estimator = cr.estimators.GPCCA(ptk)
estimator.compute_schur(n_components=20)
estimator.plot_spectrum(real_only=True)
plt.show()
Computing Schur decomposition
Adding `adata.uns['eigendecomposition_fwd']`
       `.schur_vectors`
       `.schur_matrix`
       `.eigendecomposition`
    Finish (0:00:05)
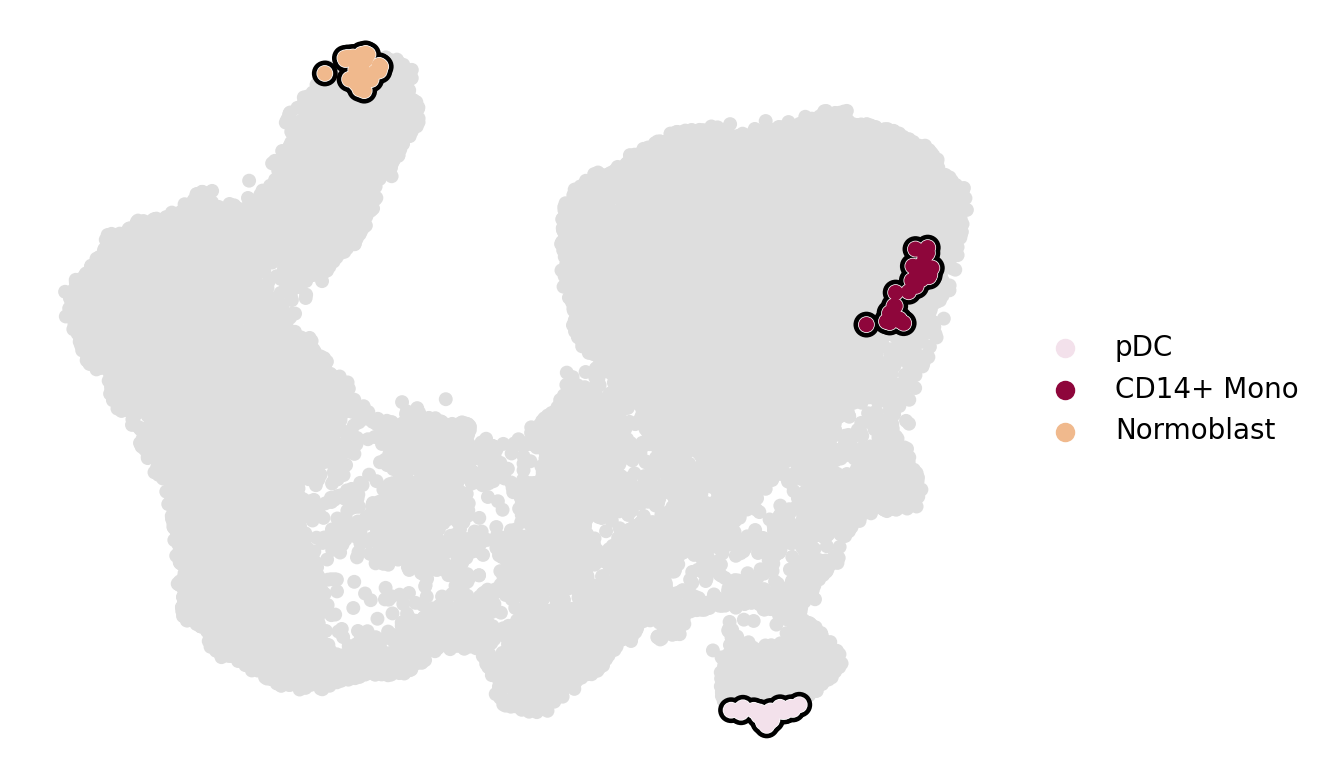
estimator.compute_macrostates(3, cluster_key="l2_cell_type")
if running_in_notebook():
    estimator.plot_macrostates(which="all", basis="umap", title="", legend_loc="right", size=100)
Computing `3` macrostates
DEBUG: Setting the macrostates using macrostates memberships
DEBUG: Raising an exception if there are less than `6` cells.
Adding `.macrostates`
       `.macrostates_memberships`
       `.coarse_T`
       `.coarse_initial_distribution
       `.coarse_stationary_distribution`
       `.schur_vectors`
       `.schur_matrix`
       `.eigendecomposition`
    Finish (0:00:01)
terminal_states = ["CD14+ Mono", "Normoblast", "cDC2", "pDC"]
cluster_key = "l2_cell_type"
if (DATA_DIR / "hematopoiesis" / "results" / "tsi-ptk.csv").is_file():
tsi_df = pd.read_csv(DATA_DIR / "hematopoiesis" / "results" / "tsi-ptk.csv")
estimator._tsi = AnnData(tsi_df, uns={"terminal_states": terminal_states, "cluster_key": cluster_key})
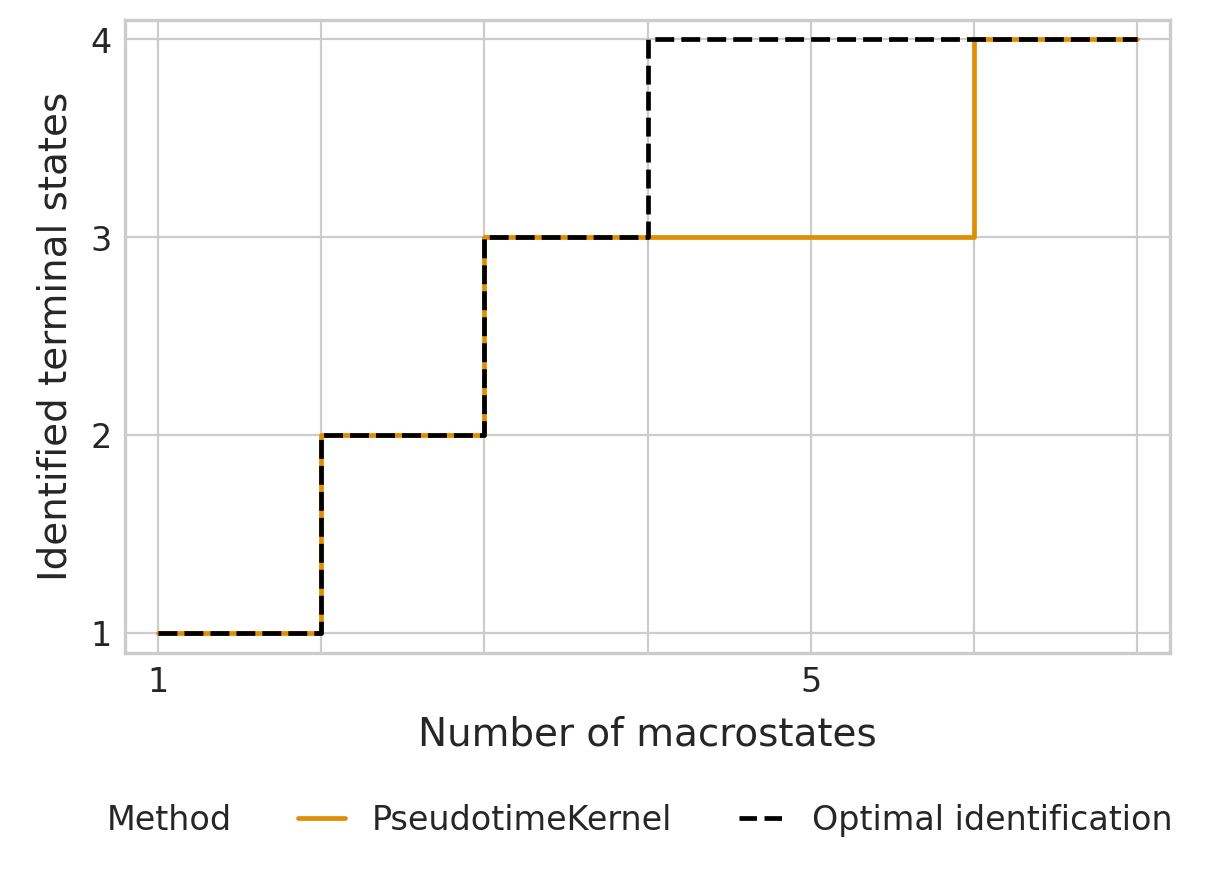
tsi_score = estimator.tsi(n_macrostates=7, terminal_states=terminal_states, cluster_key=cluster_key)
else:
tsi_score = estimator.tsi(n_macrostates=7, terminal_states=terminal_states, cluster_key=cluster_key)
estimator._tsi.to_df().to_csv(DATA_DIR / "hematopoiesis" / "results" / "tsi-ptk.csv", index=False)
print(f"TSI score: {tsi_score:.2f}")
TSI score: 0.91
/vol/storage/miniconda3/envs/cr2-py38/lib/python3.8/site-packages/anndata/_core/anndata.py:121: ImplicitModificationWarning: Transforming to str index.
  warnings.warn("Transforming to str index.", ImplicitModificationWarning)
palette = {"PseudotimeKernel": "#DE8F05", "Optimal identification": "#000000"}

if SAVE_FIGURES:
    fname = FIG_DIR / "pseudotime_kernel" / "hematopoiesis" / f"tsi-dpt.{FIGURE_FORMAT}"
else:
    fname = None

with mplscience.style_context():
    sns.set_style(style="whitegrid")
    estimator.plot_tsi(palette=palette, save=fname)
    plt.show()
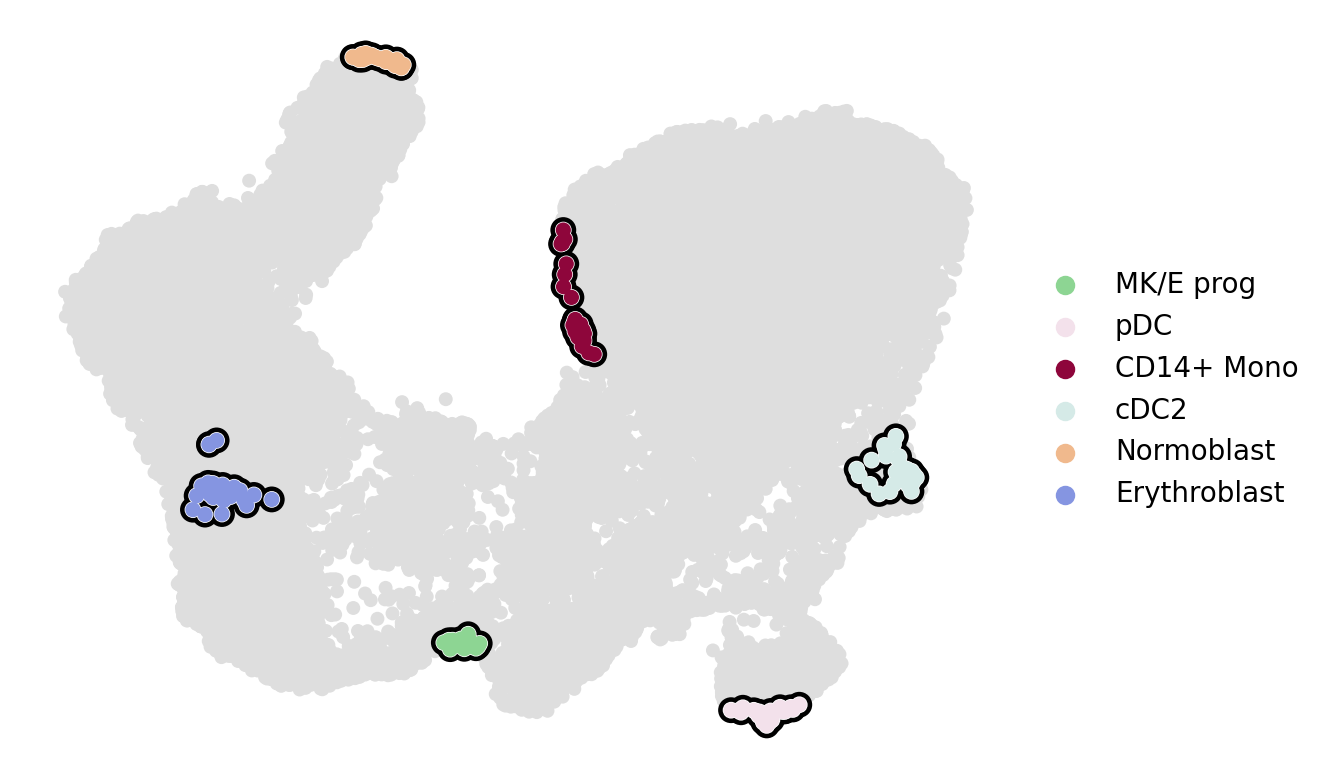
estimator.compute_macrostates(6, cluster_key="l2_cell_type")
if running_in_notebook():
    estimator.plot_macrostates(which="all", basis="umap", title="", legend_loc="right", size=100)
    if SAVE_FIGURES:
        fpath = FIG_DIR / "pseudotime_kernel" / "hematopoiesis" / f"umap_colored_by_cr_dpt_macrostates.{FIGURE_FORMAT}"
        estimator.plot_macrostates(which="all", basis="umap", title="", legend_loc=False, size=100, save=fpath)
Computing `6` macrostates
DEBUG: Setting the macrostates using macrostates memberships
DEBUG: Raising an exception if there are less than `6` cells.
Adding `.macrostates`
       `.macrostates_memberships`
       `.coarse_T`
       `.coarse_initial_distribution
       `.coarse_stationary_distribution`
       `.schur_vectors`
       `.schur_matrix`
       `.eigendecomposition`
    Finish (0:00:12)
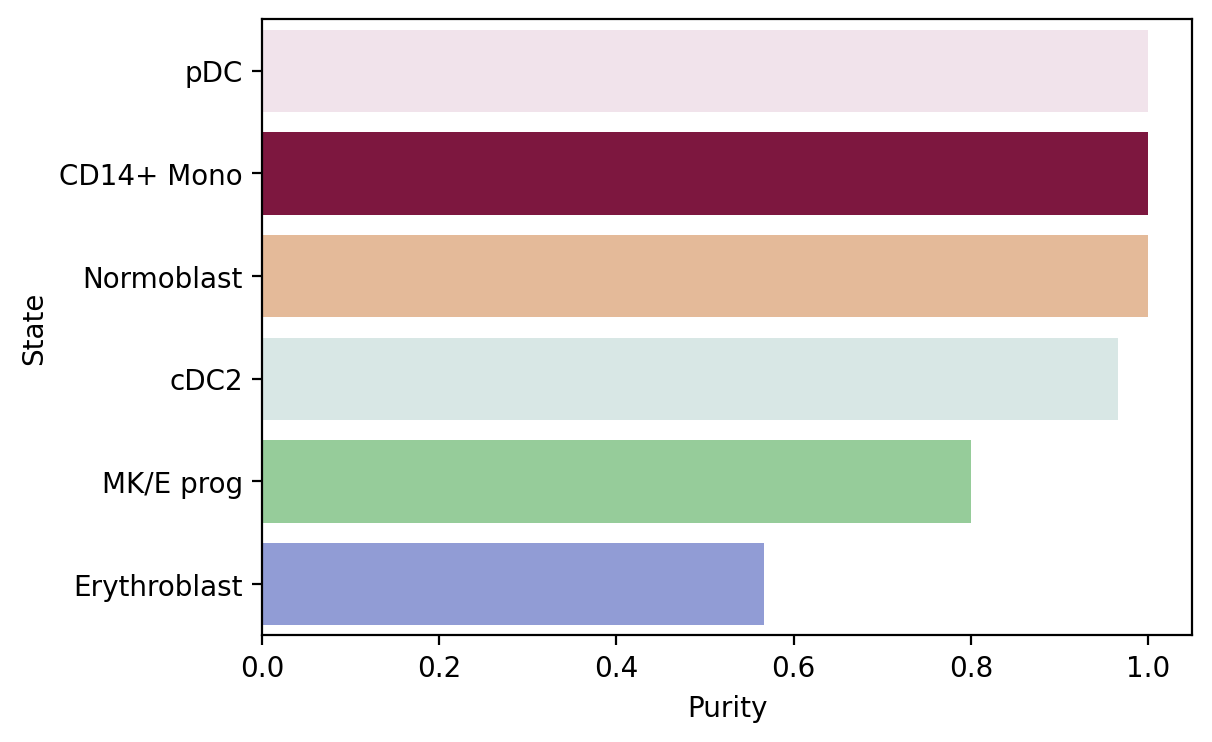
macrostate_purity = get_state_purity(adata, estimator, states="macrostates", obs_col="l2_cell_type")
print(f"Mean purity: {np.mean(list(macrostate_purity.values()))}")

if running_in_notebook():
    if SAVE_FIGURES:
        fpath = FIG_DIR / "pseudotime_kernel" / "hematopoiesis" / f"dpt_macrostate_purity.{FIGURE_FORMAT}"
    else:
        fpath = None

    palette = dict(zip(estimator.macrostates.cat.categories, estimator._macrostates.colors))

    plot_state_purity(macrostate_purity, palette=palette, fpath=fpath, format=FIGURE_FORMAT)
    plt.show()
Mean purity: 0.8888888888888888
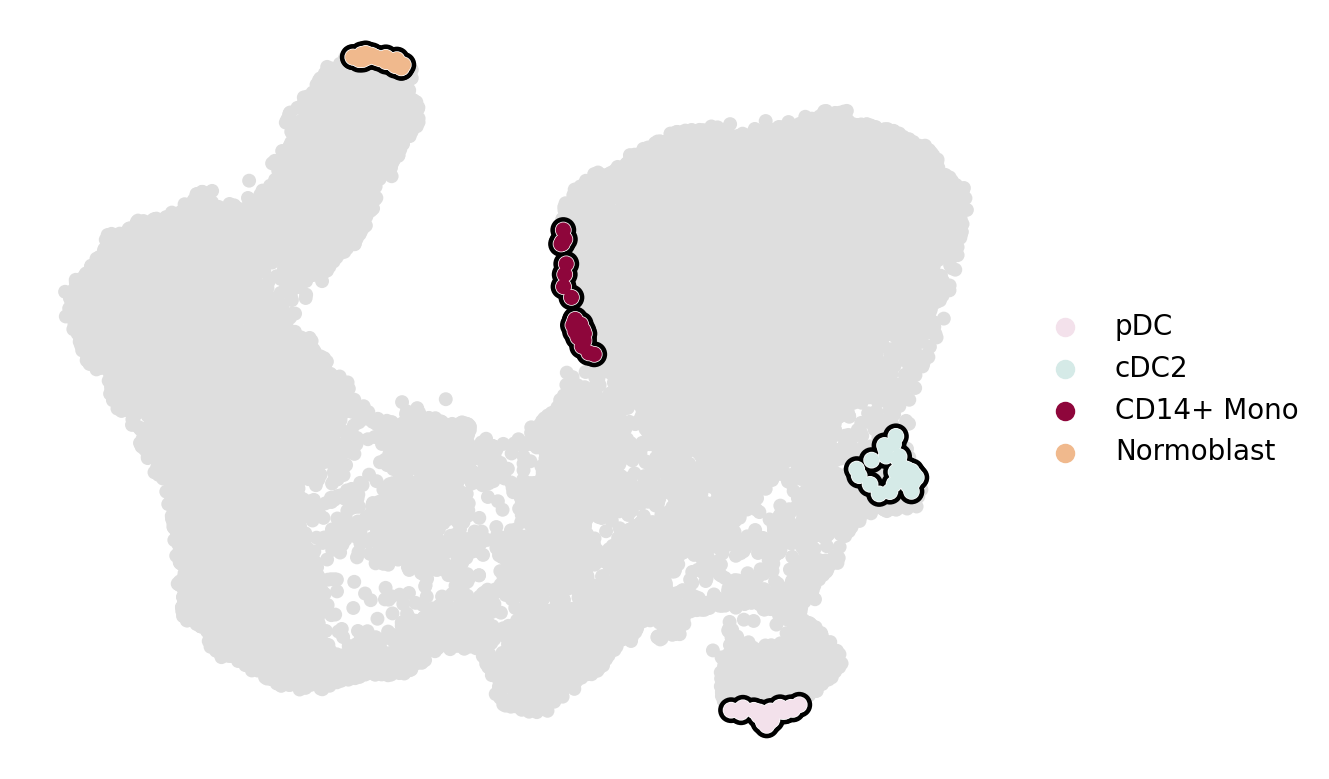
estimator.set_terminal_states(["pDC", "cDC2", "CD14+ Mono", "Normoblast"])
if running_in_notebook():
    estimator.plot_macrostates(which="terminal", basis="umap", title="", legend_loc="right", size=100)
    if SAVE_FIGURES:
        fpath = (
            FIG_DIR / "pseudotime_kernel" / "hematopoiesis" / f"umap_colored_by_cr_dpt_terminal_states.{FIGURE_FORMAT}"
        )
        estimator.plot_macrostates(which="terminal", basis="umap", title="", legend_loc=False, size=100, save=fpath)
DEBUG: Raising an exception if there are less than `6` cells.
Adding `adata.obs['term_states_fwd']`
       `adata.obs['term_states_fwd_probs']`
       `.terminal_states`
       `.terminal_states_probabilities`
       `.terminal_states_memberships
    Finish`
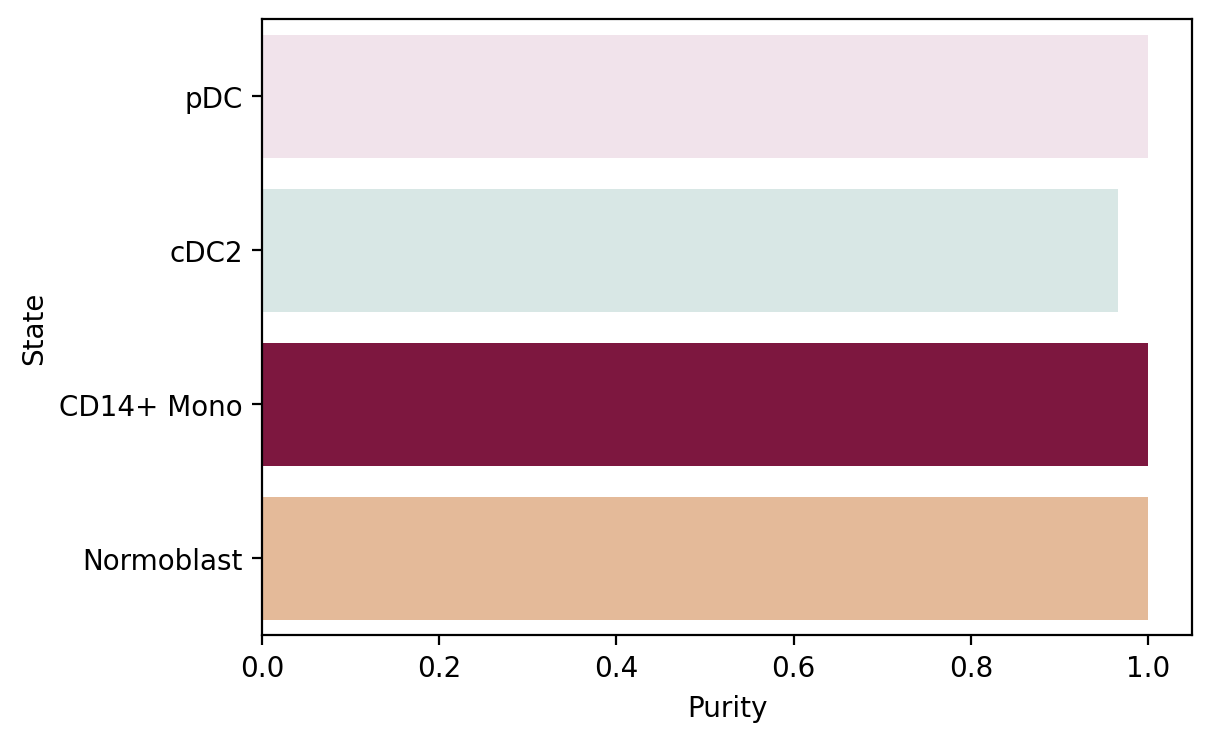
terminal_state_purity = get_state_purity(adata, estimator, states="terminal_states", obs_col="l2_cell_type")
print(f"Mean purity: {np.mean(list(macrostate_purity.values()))}")

if running_in_notebook():
    if SAVE_FIGURES:
        fpath = FIG_DIR / "pseudotime_kernel" / "hematopoiesis" / f"dpt_terminal_states_purity.{FIGURE_FORMAT}"
    else:
        fpath = None

    palette = dict(zip(estimator.terminal_states.cat.categories, estimator._term_states.colors))

    plot_state_purity(
        terminal_state_purity,
        palette=palette,
        order=["pDC", "cDC2", "CD14+ Mono", "Normoblast"],
        fpath=fpath,
        format=FIGURE_FORMAT,
    )
    plt.show()
Mean purity: 0.8888888888888888
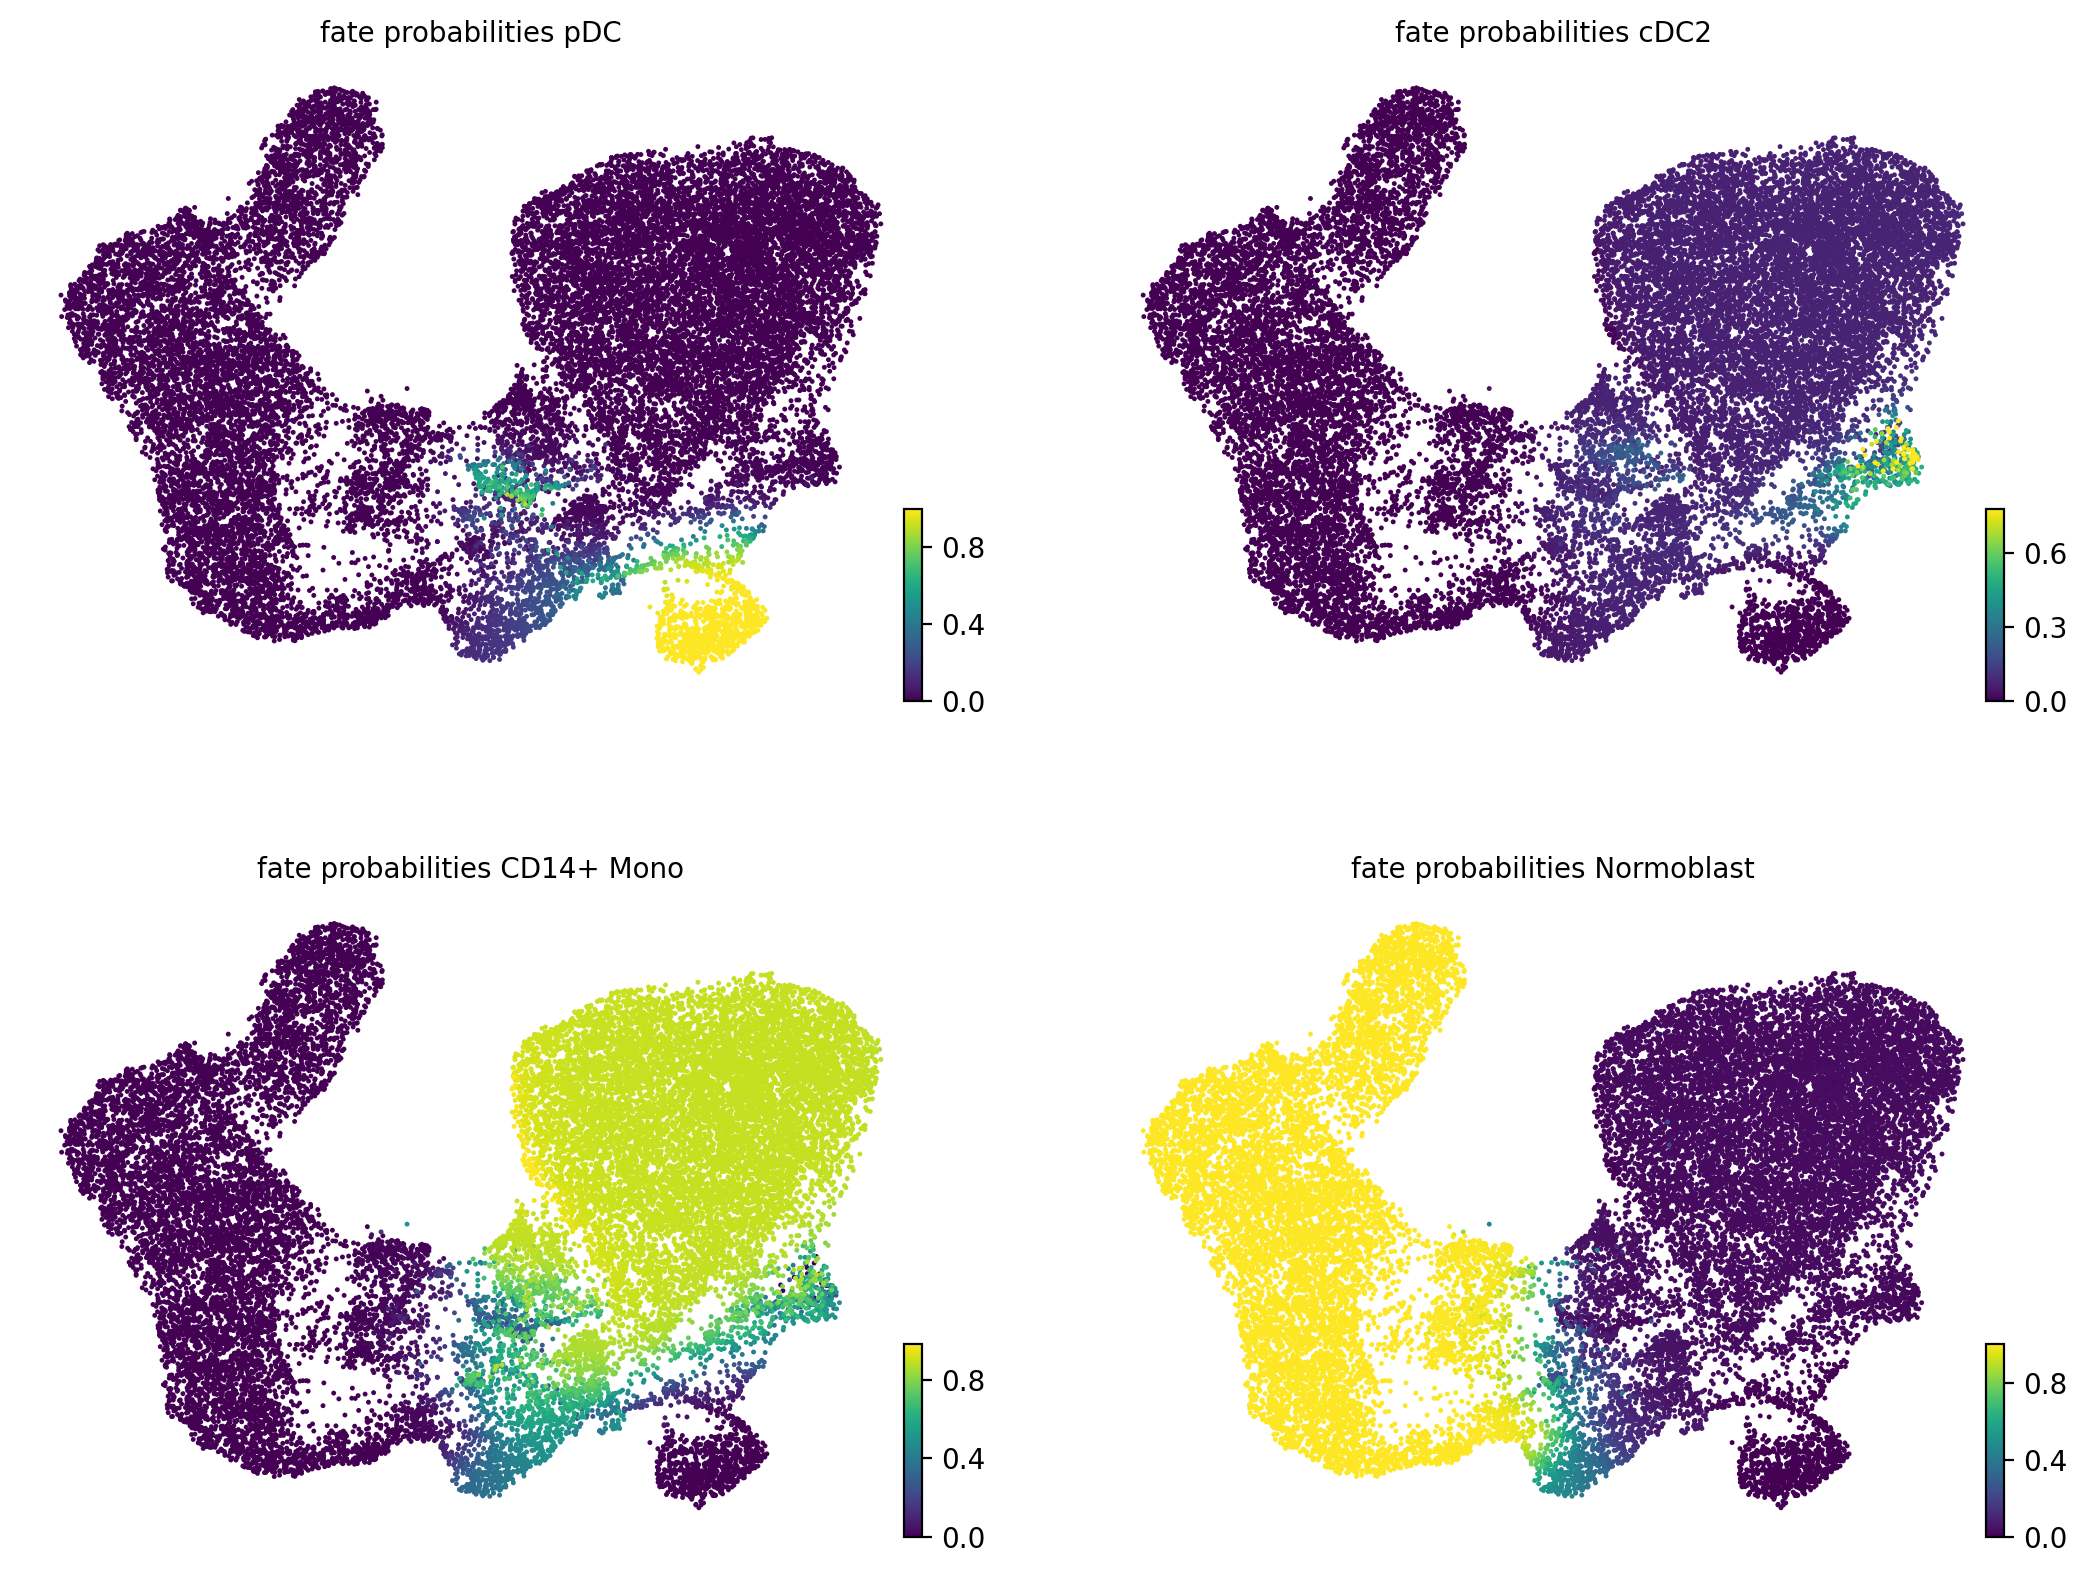
estimator.compute_fate_probabilities(tol=1e-7)
if running_in_notebook():
    estimator.plot_fate_probabilities(same_plot=False, basis="umap", ncols=2)

if SAVE_FIGURES:
    adata.obs["fate_prob_pDC"] = adata.obsm["lineages_fwd"][:, "pDC"].X.squeeze()
    adata.obs["fate_prob_cDC2"] = adata.obsm["lineages_fwd"][:, "cDC2"].X.squeeze()
    adata.obs["fate_prob_CD14+Mono"] = adata.obsm["lineages_fwd"][:, "CD14+ Mono"].X.squeeze()
    adata.obs["fate_prob_Normoblast"] = adata.obsm["lineages_fwd"][:, "Normoblast"].X.squeeze()

    for terminal_state in ["pDC", "cDC2", "CD14+Mono", "Normoblast"]:
        fig, ax = plt.subplots(figsize=(6, 4))

        if running_in_notebook():
            scv.pl.scatter(
                adata,
                basis="umap",
                color=f"fate_prob_{terminal_state}",
                cmap="viridis",
                title="",
                colorbar=False,
                ax=ax,
            )

            fig.savefig(
                FIG_DIR / "pseudotime_kernel" / "hematopoiesis" / f"dpt_fate_prob_{terminal_state}.{FIGURE_FORMAT}",
                format=FIGURE_FORMAT,
                transparent=True,
                bbox_inches="tight",
            )
Computing fate probabilities
DEBUG: Solving the linear system using `PETSc` solver `'gmres'` on `1` core(s) with no preconditioner and `tol=1e-07`
Adding `adata.obsm['lineages_fwd']`
       `.fate_probabilities`
    Finish (0:00:00)
[0]PETSC ERROR: ------------------------------------------------------------------------
[0]PETSC ERROR: Caught signal number 13 Broken Pipe: Likely while reading or writing to a socket
[0]PETSC ERROR: Try option -start_in_debugger or -on_error_attach_debugger
[0]PETSC ERROR: or see https://petsc.org/release/faq/#valgrind and https://petsc.org/release/faq/
[0]PETSC ERROR: configure using --with-debugging=yes, recompile, link, and run
[0]PETSC ERROR: to get more information on the crash.
Abort(59) on node 0 (rank 0 in comm 0): application called MPI_Abort(MPI_COMM_WORLD, 59) - process 0
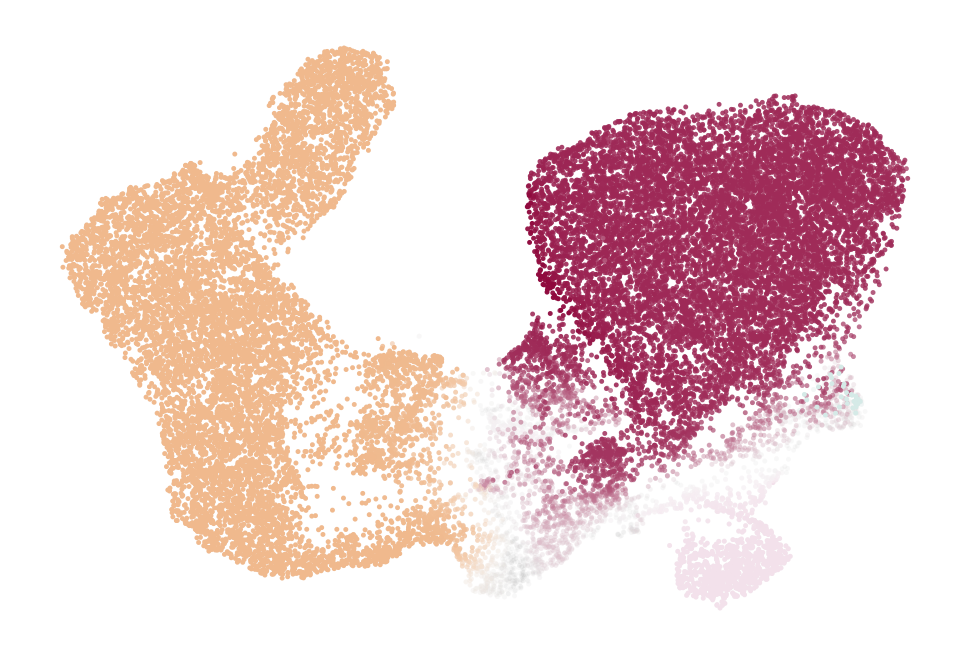
if running_in_notebook():
    if SAVE_FIGURES:
        fname = f"{FIG_DIR}/pseudotime_kernel/hematopoiesis/umap_colored_by_dpt_fate.{FIGURE_FORMAT}"
    else:
        fname = False
    fig, ax = plt.subplots(figsize=(6, 4))
    estimator.plot_fate_probabilities(
        same_plot=True,
        basis="umap",
        title="",
        legend_loc=False,
        save=fname,
        ax=ax,
    )
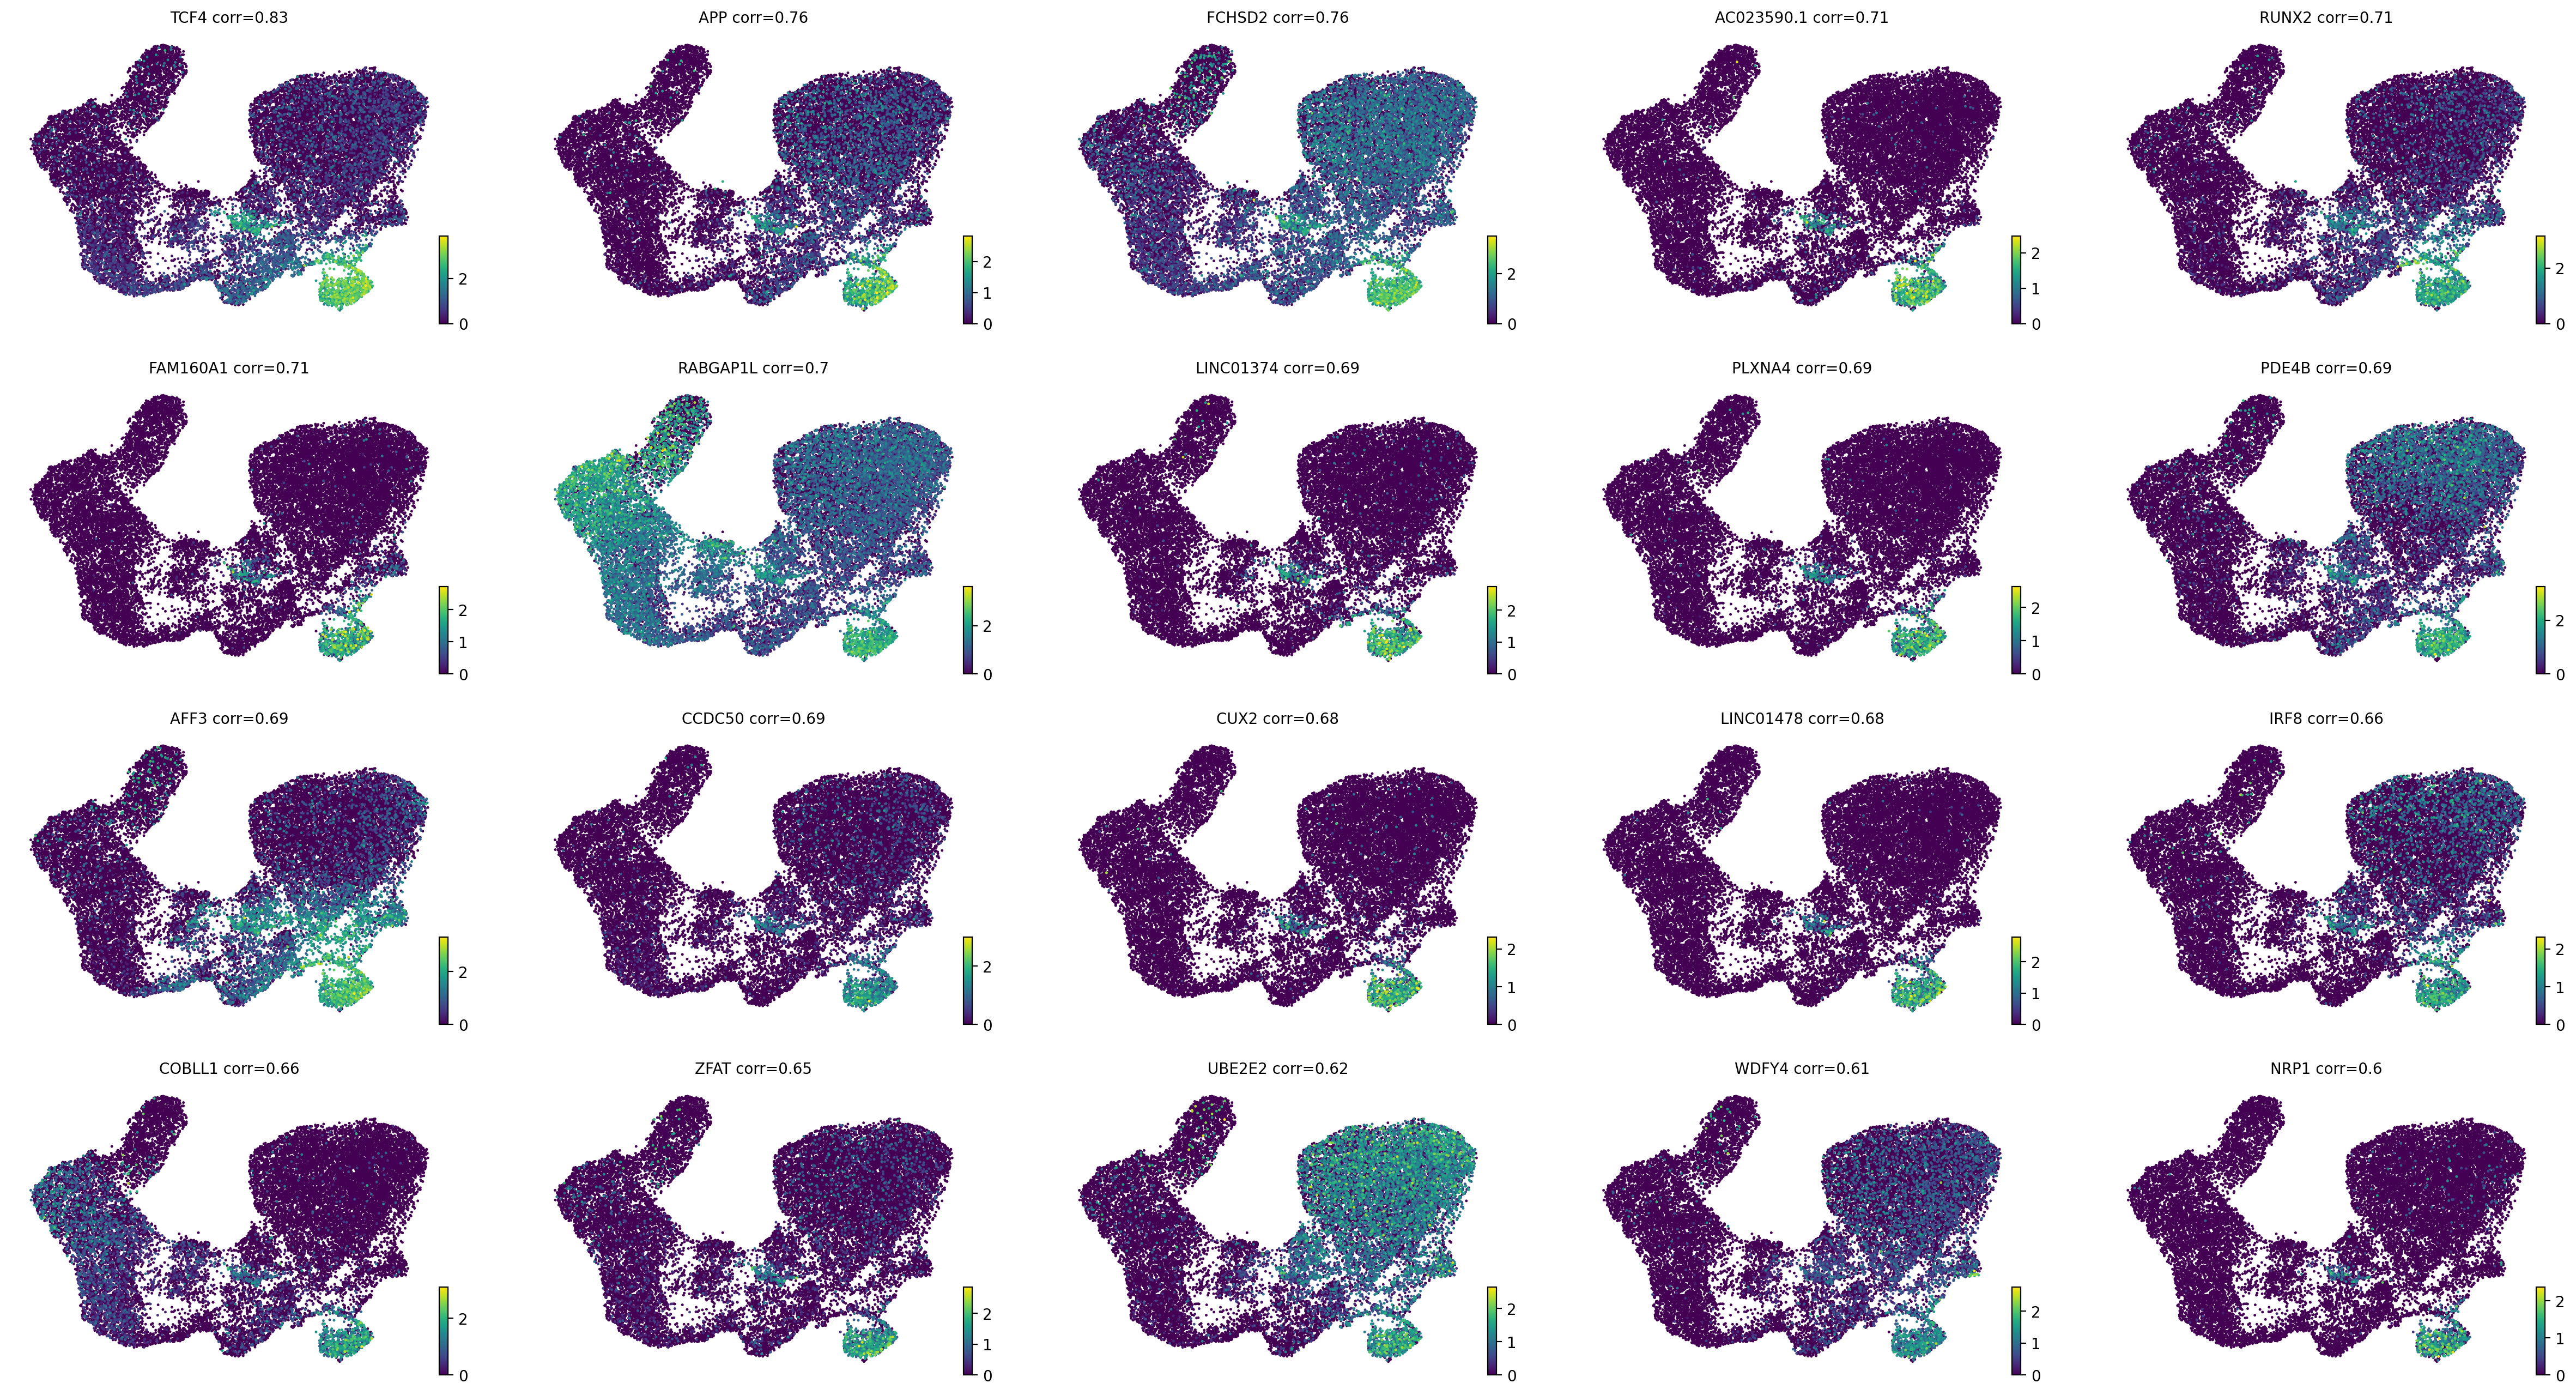
Driver analysis#
drivers = estimator.compute_lineage_drivers(
    return_drivers=True, cluster_key="l2_cell_type", lineages=["pDC"], clusters=["HSC", "pDC"]
)

if running_in_notebook():
    estimator.plot_lineage_drivers(lineage="pDC", n_genes=20, ncols=5, title_fmt="{gene} corr={corr:.2}")
    plt.show()
DEBUG: Computing correlations for lineages `['pDC']` restricted to clusters `['HSC', 'pDC']` in layer `X` with `use_raw=False`
Adding `adata.varm['terminal_lineage_drivers']`
       `.lineage_drivers`
    Finish (0:00:00)
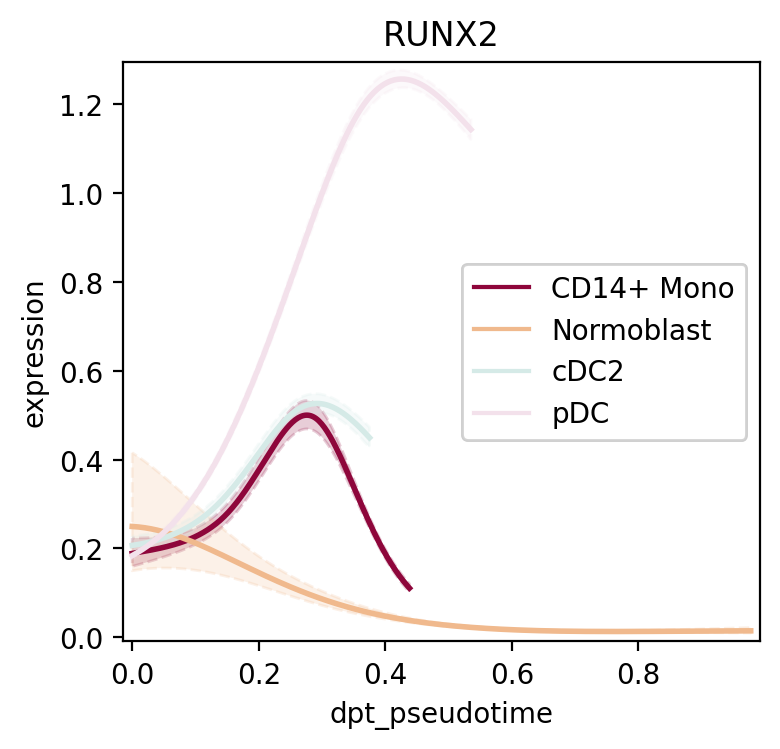
model = cr.models.GAM(adata)
if SAVE_FIGURES:
save = FIG_DIR / "pseudotime_kernel" / "hematopoiesis" / f"gene_trend_runx2.{FIGURE_FORMAT}"
else:
save = None
cr.pl.gene_trends(
adata,
model=model,
genes="RUNX2",
time_key="dpt_pseudotime",
hide_cells=True,
same_plot=True,
lineage_cmap=["#8e063b", "#f0b98d", "#d5eae7", "#f3e1eb"],
figsize=(4, 4),
save=save,
)
plt.show()
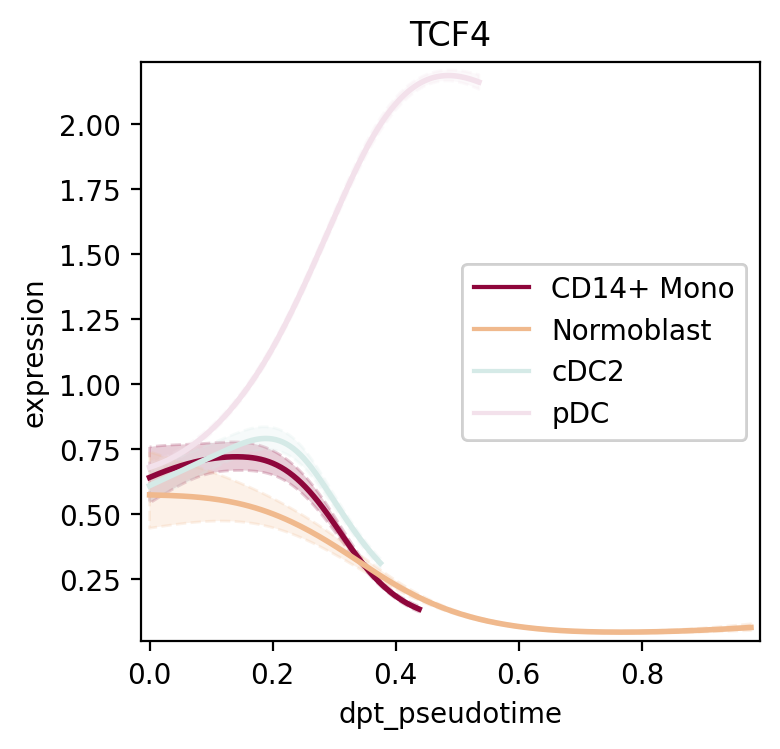
if SAVE_FIGURES:
save = FIG_DIR / "pseudotime_kernel" / "hematopoiesis" / f"gene_trend_tcf4.{FIGURE_FORMAT}"
else:
save = None
cr.pl.gene_trends(
adata,
model=model,
genes="TCF4",
time_key="dpt_pseudotime",
hide_cells=True,
same_plot=True,
lineage_cmap=["#8e063b", "#f0b98d", "#d5eae7", "#f3e1eb"],
figsize=(4, 4),
save=save,
)
plt.show()
Computing trends using `1` core(s)
    Finish (0:00:00)
Plotting trends
DEBUG: Key `None` not found in `adata.obs` or `adata.var_names`. Ignoring`
DEBUG: Key `None` not found in `adata.obs` or `adata.var_names`. Ignoring`
DEBUG: Key `None` not found in `adata.obs` or `adata.var_names`. Ignoring`
DEBUG: Key `None` not found in `adata.obs` or `adata.var_names`. Ignoring`
DEBUG: Key `None` not found in `adata.obs` or `adata.var_names`. Ignoring`
[0]PETSC ERROR: ------------------------------------------------------------------------
[0]PETSC ERROR: Caught signal number 13 Broken Pipe: Likely while reading or writing to a socket
Computing trends using `1` core(s)
    Finish (0:00:01)
Plotting trends
DEBUG: Key `None` not found in `adata.obs` or `adata.var_names`. Ignoring`
DEBUG: Key `None` not found in `adata.obs` or `adata.var_names`. Ignoring`
DEBUG: Key `None` not found in `adata.obs` or `adata.var_names`. Ignoring`
DEBUG: Key `None` not found in `adata.obs` or `adata.var_names`. Ignoring`
DEBUG: Key `None` not found in `adata.obs` or `adata.var_names`. Ignoring`
[0]PETSC ERROR: ------------------------------------------------------------------------
[0]PETSC ERROR: Caught signal number 13 Broken Pipe: Likely while reading or writing to a socket
[0]PETSC ERROR: Try option -start_in_debugger or -on_error_attach_debugger
[0]PETSC ERROR: or see https://petsc.org/release/faq/#valgrind and https://petsc.org/release/faq/
[0]PETSC ERROR: configure using --with-debugging=yes, recompile, link, and run
[0]PETSC ERROR: to get more information on the crash.
Abort(59) on node 0 (rank 0 in comm 0): application called MPI_Abort(MPI_COMM_WORLD, 59) - process 0