Hematopoiesis - Initial state identification#
Construct diffusion pseudotime on NeurIPS 2021 hematopoiesis data.
import sys

import pandas as pd

import matplotlib.pyplot as plt
import seaborn as sns

import cellrank as cr
import scanpy as sc
import scvelo as scv

from cr2 import running_in_notebook

sys.path.extend(["../../../", "."])
from paths import DATA_DIR, FIG_DIR  # isort: skip  # noqa: E402
Global seed set to 0
General settings#
sc.settings.verbosity = 2
cr.settings.verbosity = 4
scv.settings.verbosity = 3
scv.settings.set_figure_params("scvelo", dpi_save=400, dpi=80, transparent=True, fontsize=20, color_map="viridis")
SAVE_FIGURES = False
if SAVE_FIGURES:
    (FIG_DIR / "pseudotime_kernel" / "hematopoiesis").mkdir(parents=True, exist_ok=True)

FIGURE_FORMAT = "pdf"
(DATA_DIR / "hematopoiesis" / "results").mkdir(parents=True, exist_ok=True)
Constants#
CELLTYPES_TO_KEEP = [
    "HSC",
    "MK/E prog",
    "Proerythroblast",
    "Erythroblast",
    "Normoblast",
    "cDC2",
    "pDC",
    "G/M prog",
    "CD14+ Mono",
]
Data loading#
adata = sc.read(DATA_DIR / "hematopoiesis" / "processed" / "gex_preprocessed.h5ad")
adata
AnnData object with n_obs × n_vars = 67568 × 25629
    obs: 'site', 'donor', 'batch', 'l1_cell_type', 'l2_cell_type'
    var: 'hvg_multiVI'
    uns: 'neighbors', 'umap'
    obsm: 'MultiVI_latent', 'X_umap'
    layers: 'counts'
    obsp: 'connectivities', 'distances'
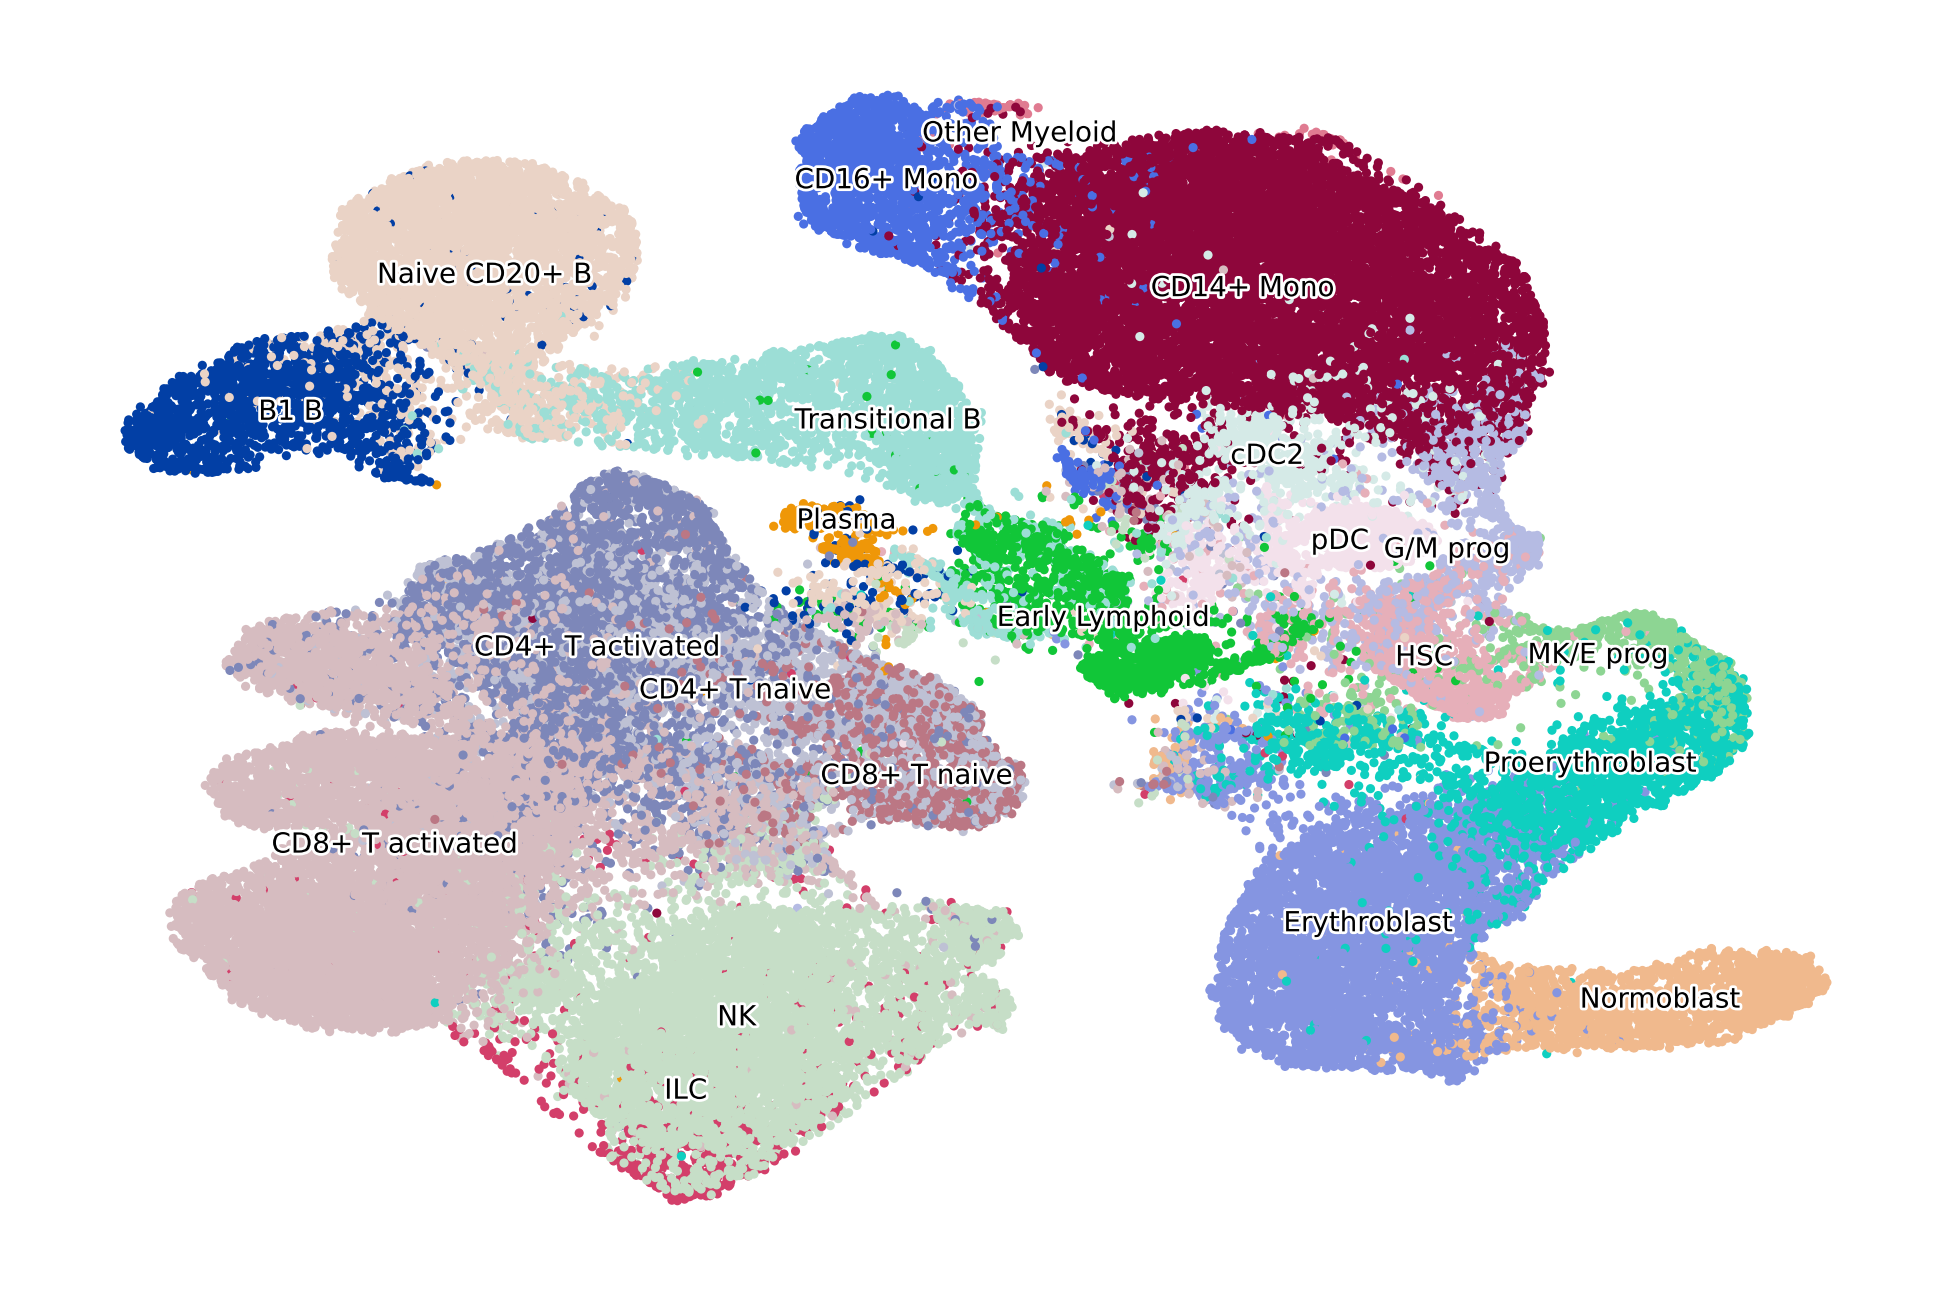
if running_in_notebook():
    scv.pl.scatter(adata, basis="X_umap", c="l2_cell_type", dpi=200, title="", legend_fontsize=5, legend_fontweight=1)
Data preprocessing#
adata = adata[adata.obs["l2_cell_type"].isin(CELLTYPES_TO_KEEP), :].copy()
adata
AnnData object with n_obs × n_vars = 24440 × 25629
    obs: 'site', 'donor', 'batch', 'l1_cell_type', 'l2_cell_type'
    var: 'hvg_multiVI'
    uns: 'neighbors', 'umap', 'l2_cell_type_colors'
    obsm: 'MultiVI_latent', 'X_umap'
    layers: 'counts'
    obsp: 'connectivities', 'distances'
sc.pp.neighbors(adata, use_rep="MultiVI_latent")
sc.tl.umap(adata)
computing neighbors
    finished (0:02:34)
computing UMAP
    finished (0:00:12)
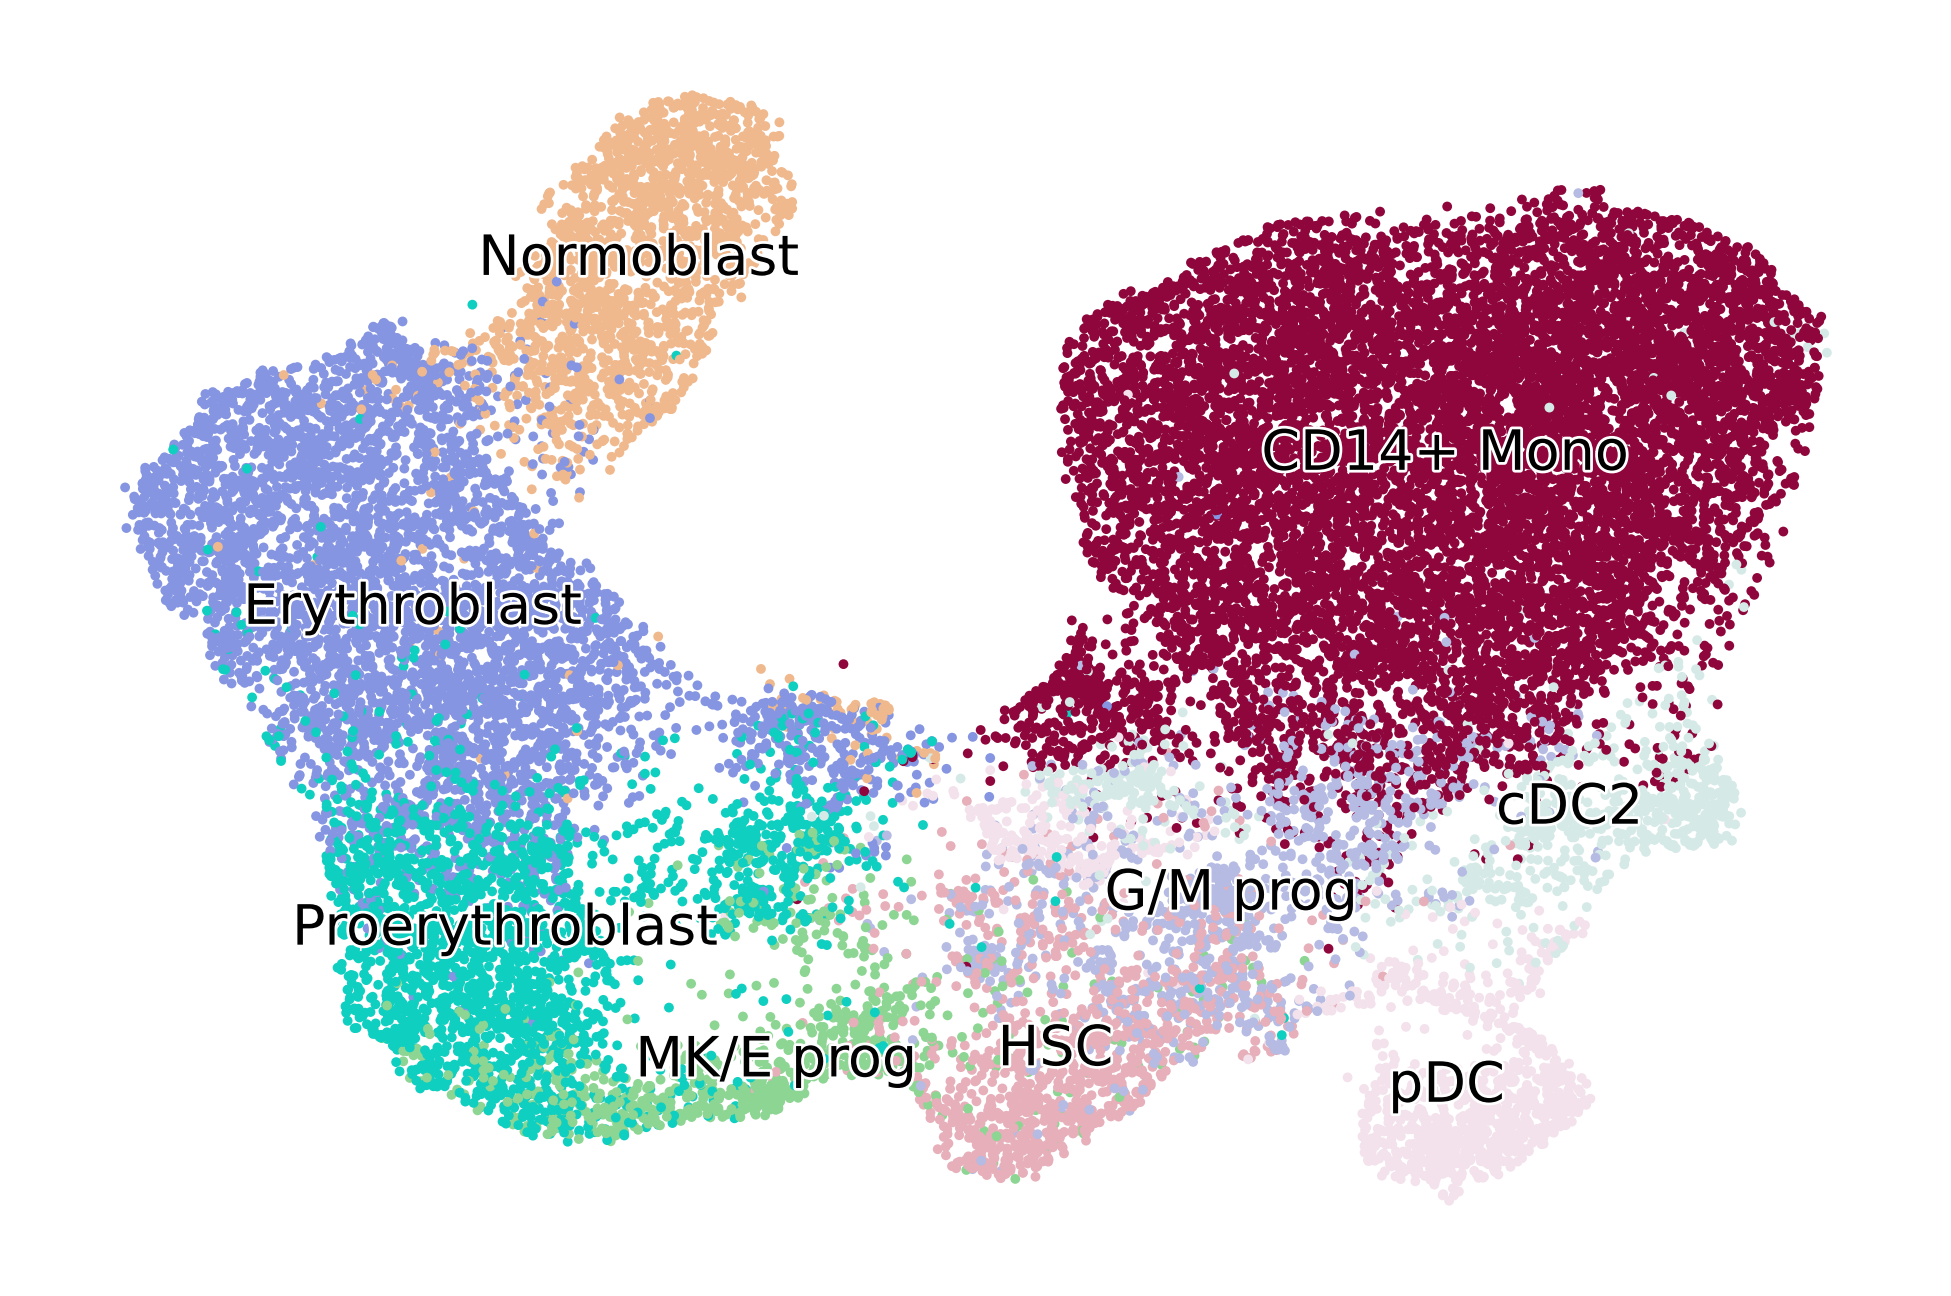
if running_in_notebook():
    scv.pl.scatter(
        adata,
        basis="X_umap",
        c="l2_cell_type",
        dpi=200,
        title="",
        legend_fontsize=10,
        legend_fontweight=5,
    )
Diffusion pseudotime#
sc.tl.diffmap(adata, n_comps=15)
computing Diffusion Maps using n_comps=15(=n_dcs)
computing transitions
    finished (0:00:00)
    eigenvalues of transition matrix
    [1.         0.99922997 0.9977195  0.9968419  0.9955766  0.9942717
     0.9900949  0.9884704  0.9867782  0.9852537  0.9849594  0.9830871
     0.98229724 0.9809607  0.97756666]
    finished (0:00:02)
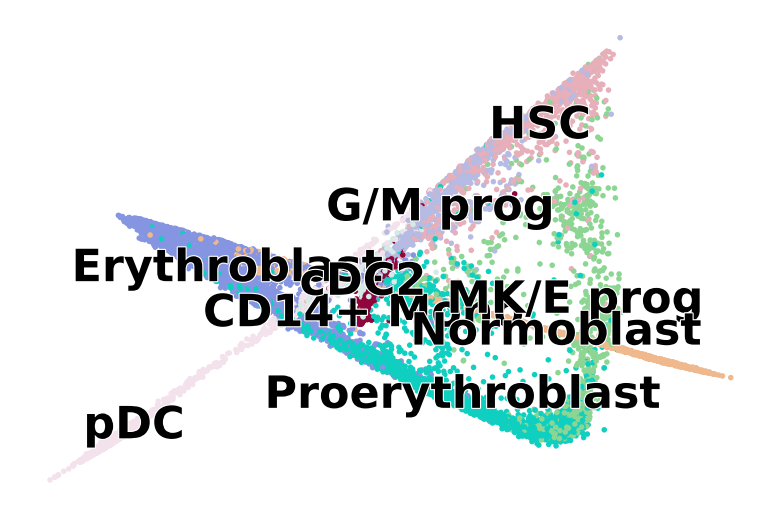
if running_in_notebook():
    fig, ax = plt.subplots(figsize=(6, 4))
    scv.pl.scatter(
        adata, basis="diffmap", color=["l2_cell_type"], components=["4, 5"], size=25, dpi=100, title="", ax=ax
    )
adata.obs["hsc_cluster"] = (
adata.obs["l2_cell_type"]
.astype("str")
.replace(
{
"MK/E prog": "nan",
"Proerythroblast": "nan",
"Erythroblast": "nan",
"Normoblast": "nan",
"cDC2": "nan",
"pDC": "nan",
"G/M prog": "nan",
"CD14+ Mono": "nan",
}
)
.astype("category")
.cat.reorder_categories(["nan", "HSC"])
.copy()
)
celltype_colors = dict(zip(adata.obs["l2_cell_type"].cat.categories, adata.uns["l2_cell_type_colors"]))
adata.uns["hsc_cluster_colors"] = ["#dedede", celltype_colors["HSC"]]
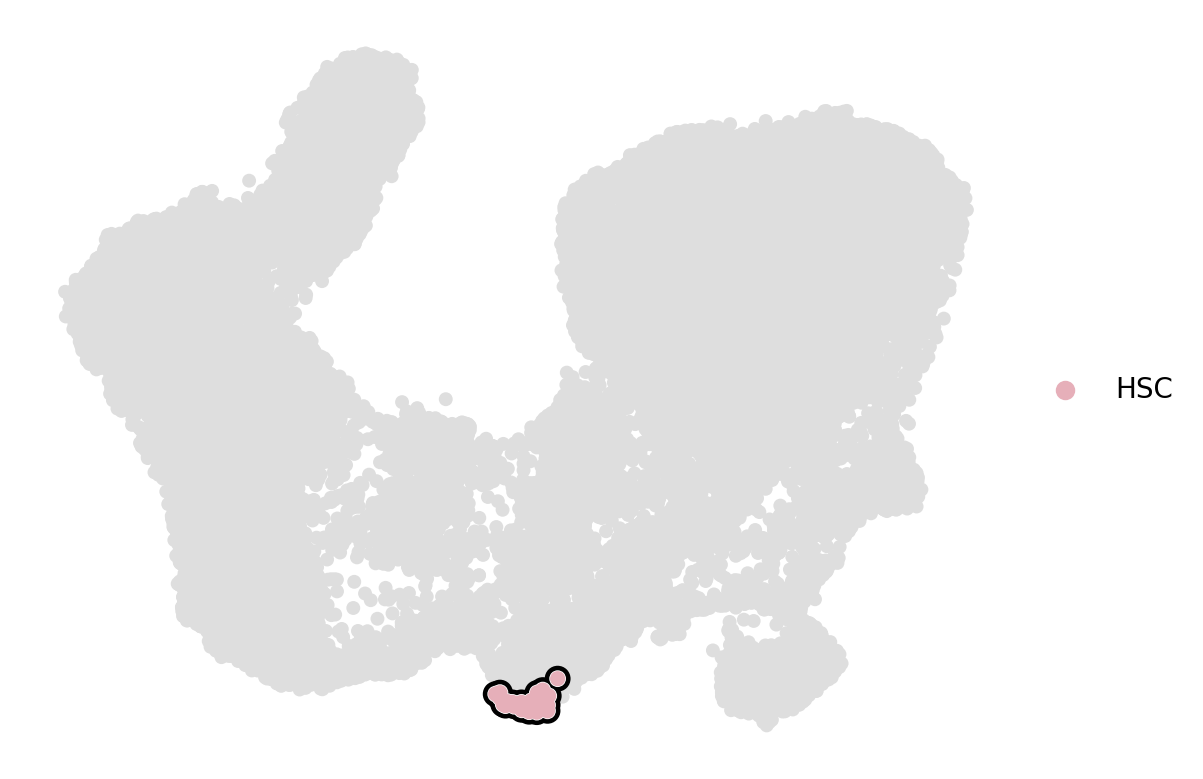
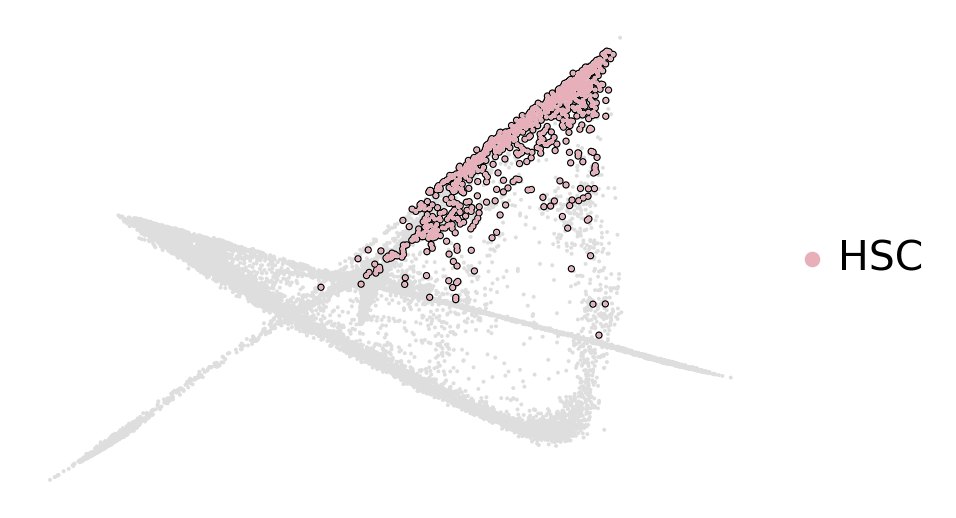
if running_in_notebook():
fig, ax = plt.subplots(figsize=(6, 4))
scv.pl.scatter(
adata,
basis="diffmap",
c=["hsc_cluster"],
legend_loc="right",
components=["4, 5"],
add_outline="HSC",
title="",
ax=ax,
)
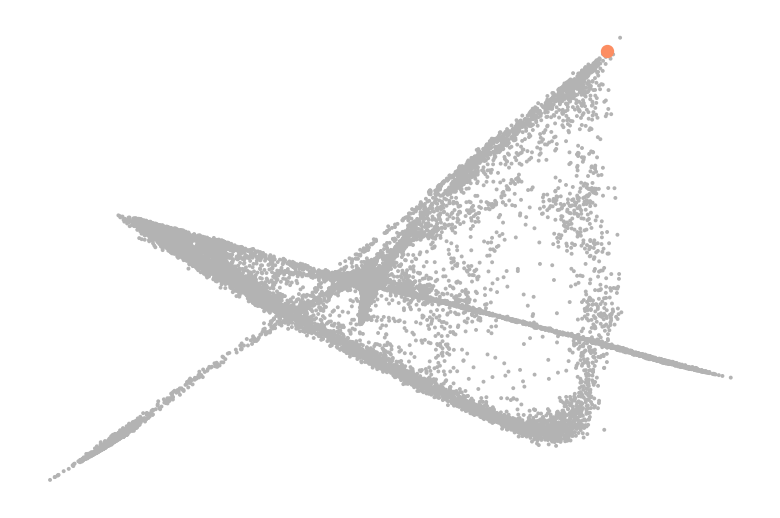
df = (
    pd.DataFrame(
        {
            "diff_comp": adata.obsm["X_diffmap"][:, 5],
            "cell_type": adata.obs["l2_cell_type"].values,
        }
    )
    .reset_index()
    .rename({"index": "obs_id"}, axis=1)
)
df = df.loc[df["cell_type"] == "HSC", "diff_comp"]
root_idx = df.index[df.argmax()]

set2_cmap = sns.color_palette("Set2").as_hex()
palette = [set2_cmap[-1], set2_cmap[1]]

if running_in_notebook():
    fig, ax = plt.subplots(figsize=(6, 4))
    scv.pl.scatter(adata, basis="diffmap", c=root_idx, legend_loc=False, palette=palette, components=["4, 5"], ax=ax)
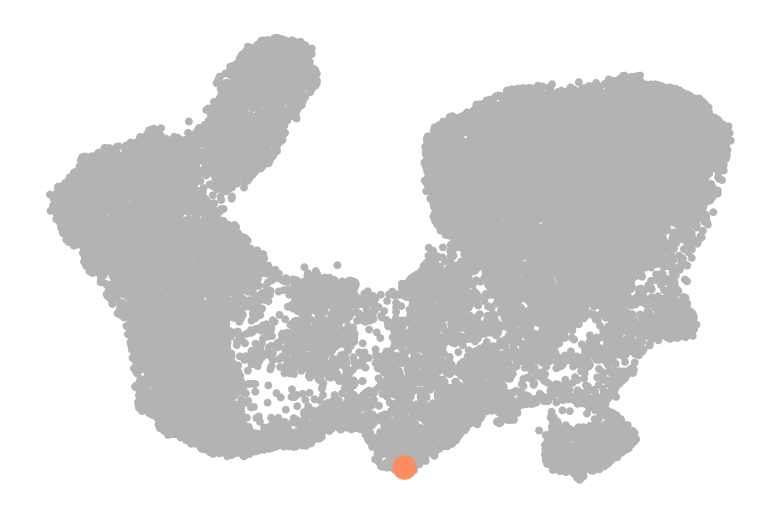
adata.uns["iroot"] = root_idx
sc.tl.dpt(adata, n_dcs=6)
computing Diffusion Pseudotime using n_dcs=6
    finished (0:00:00)
if running_in_notebook():
    fig, ax = plt.subplots(figsize=(6, 4))
    scv.pl.scatter(adata, basis="umap", color=root_idx, palette=palette, color_map="viridis", size=50, ax=ax)
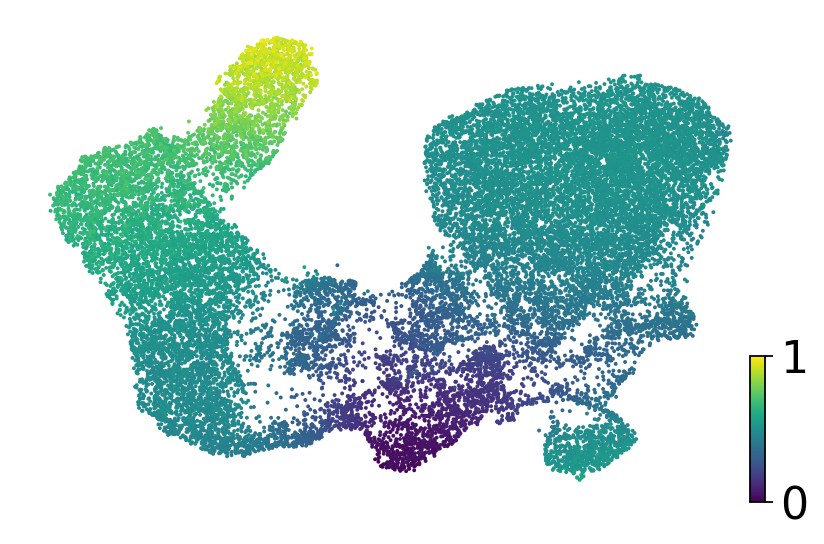
if running_in_notebook():
    fig, ax = plt.subplots(figsize=(6, 4))
    scv.pl.scatter(adata, basis="umap", color="dpt_pseudotime", title="", color_map="viridis", ax=ax)
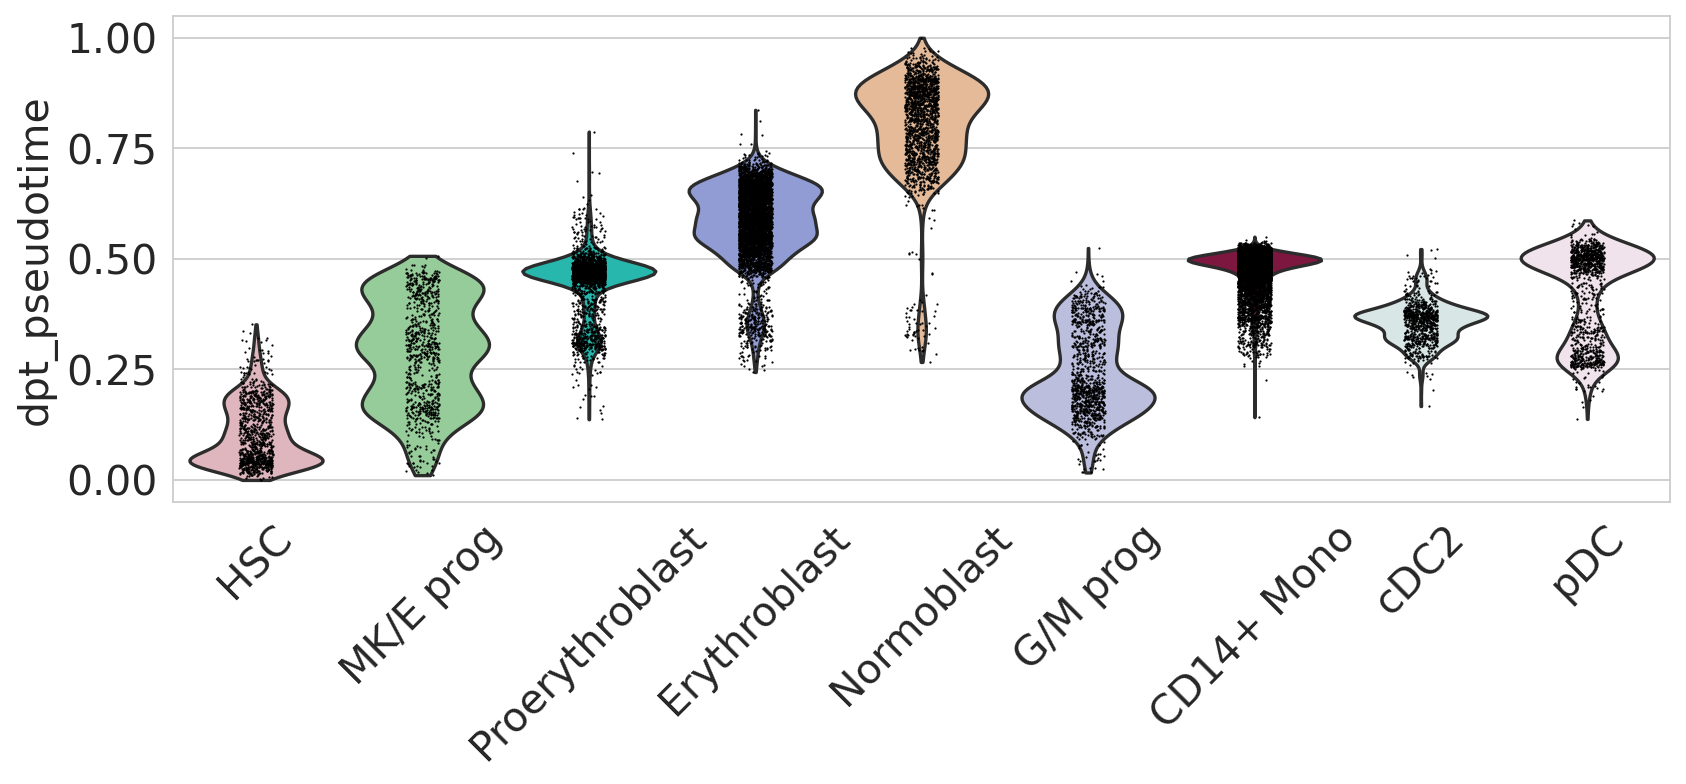
if running_in_notebook():
    sns.set_style(style="whitegrid")
    fig, ax = plt.subplots(figsize=(12, 4))
    sc.pl.violin(
        adata,
        keys=["dpt_pseudotime"],
        groupby="l2_cell_type",
        rotation=45,
        title="",
        legend_loc="none",
        order=[
            "HSC",
            "MK/E prog",
            "Proerythroblast",
            "Erythroblast",
            "Normoblast",
            "G/M prog",
            "CD14+ Mono",
            "cDC2",
            "pDC",
        ],
        ax=ax,
    )

    sns.reset_orig()
CellRank#
Kernel#
ptk = cr.kernels.PseudotimeKernel(adata, time_key="dpt_pseudotime").compute_transition_matrix(threshold_scheme="soft")
ptk.transition_matrix = ptk.transition_matrix.T
Computing transition matrix based on pseudotime
Finish (0:00:14)
Estimator#
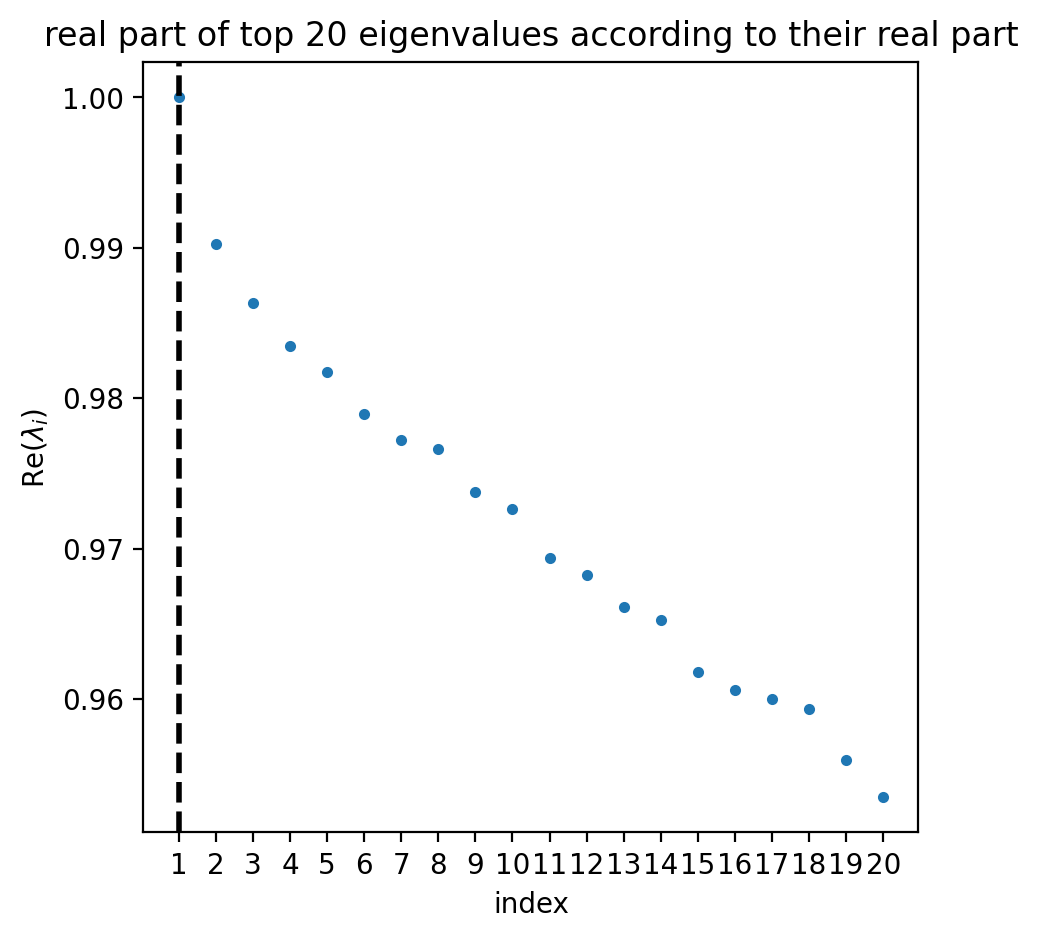
estimator = cr.estimators.GPCCA(ptk)
estimator.compute_schur(n_components=20)
estimator.plot_spectrum(real_only=True)
plt.show()
Computing Schur decomposition
Adding `adata.uns['eigendecomposition_fwd']`
       `.schur_vectors`
       `.schur_matrix`
       `.eigendecomposition`
    Finish (0:00:03)
estimator.compute_macrostates(1, cluster_key="l2_cell_type")
if running_in_notebook():
    estimator.plot_macrostates(which="all", basis="umap", title="", legend_loc="right", size=100)
    if SAVE_FIGURES:
        fpath = (
            FIG_DIR
            / "pseudotime_kernel"
            / "hematopoiesis"
            / f"umap_colored_by_cr_dpt_macrostates-initial_state.{FIGURE_FORMAT}"
        )
        estimator.plot_macrostates(which="all", basis="umap", title="", legend_loc=False, size=100, save=fpath)
For 1 macrostate, stationary distribution is computed
Computing eigendecomposition of the transition matrix
DEBUG: Computing top `20` eigenvalues of a sparse matrix
DEBUG: Sorting eigenvalues by their real part
Adding `adata.uns['eigendecomposition_fwd']`
       `.eigendecomposition`
    Finish (0:00:06)
DEBUG: Setting the macrostates using macrostates memberships
DEBUG: Raising an exception if there are less than `6` cells.
Adding `.macrostates`
       `.macrostates_memberships`
       `.coarse_T`
       `.coarse_initial_distribution
       `.coarse_stationary_distribution`
       `.schur_vectors`
       `.schur_matrix`
       `.eigendecomposition`
    Finish (0:00:06)