VelocityKernel vs. RealTimeKernel - TSI#
Library imports#
%load_ext autoreload
%autoreload 2
import sys

import pandas as pd

import matplotlib.pyplot as plt
import mplscience
import seaborn as sns

from cr2.analysis import plot_tsi

sys.path.extend(["../../../", "."])
from paths import DATA_DIR, FIG_DIR  # isort: skip  # noqa: E402
Global seed set to 0
General settings#
SAVE_FIGURES = False
if SAVE_FIGURES:
    (FIG_DIR / "realtime_kernel" / "mef").mkdir(parents=True, exist_ok=True)

FIGURE_FORMAT = "pdf"
Constants#
Data loading#
tsi_cr1 = pd.read_csv(DATA_DIR / "mef" / "results" / "tsi-vk.csv")
tsi_cr1.head()
| number_of_macrostates | identified_terminal_states | optimal_identification | |
|---|---|---|---|
| 0 | 17 | 3 | 4 |
| 1 | 16 | 3 | 4 |
| 2 | 15 | 3 | 4 |
| 3 | 14 | 3 | 4 |
| 4 | 13 | 3 | 4 |
tsi_cr2 = pd.read_csv(DATA_DIR / "mef" / "results" / "tsi-rtk.csv")
tsi_cr2.head()
| number_of_macrostates | identified_terminal_states | optimal_identification | |
|---|---|---|---|
| 0 | 7 | 4 | 4 |
| 1 | 6 | 4 | 4 |
| 2 | 5 | 3 | 4 |
| 3 | 4 | 3 | 4 |
| 4 | 3 | 3 | 3 |
Data preprocessing#
tsi_cr1["method"] = "CellRank 1"
tsi_cr2["method"] = "CellRank 2"

df = pd.concat([tsi_cr1, tsi_cr2])
Plotting#
palette = {"CellRank 1": "#0173b2", "CellRank 2": "#DE8F05", "Optimal identification": "#000000"}
if SAVE_FIGURES:
fname = FIG_DIR / "realtime_kernel" / "mef" / f"tsi_ranking.{FIGURE_FORMAT}"
else:
fname = None
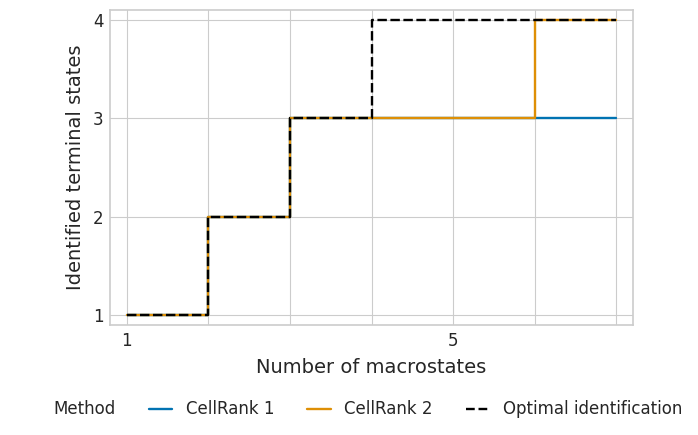
with mplscience.style_context():
sns.set_style(style="whitegrid")
plot_tsi(df=df, palette=palette, fname=fname)
plt.show()