Pharyngeal endoderm development analysis with the RealTimeKernel#
Import packages#
import sys

import numpy as np
import pandas as pd

import matplotlib.pyplot as plt
import mplscience
import seaborn as sns

import cellrank as cr
import scanpy as sc
import scvelo as scv
import wot
from anndata import AnnData

from cr2 import get_state_purity, plot_state_purity, running_in_notebook

sys.path.extend(["../../../", "."])
from paths import DATA_DIR, FIG_DIR  # isort: skip  # noqa: E402
Global seed set to 0
General settings#
sc.settings.verbosity = 2
cr.settings.verbosity = 4
scv.settings.verbosity = 3
scv.settings.set_figure_params("scvelo", dpi_save=400, dpi=80, transparent=True, fontsize=20, color_map="viridis")
SAVE_FIGURES = False
if SAVE_FIGURES:
    (FIG_DIR / "realtime_kernel" / "pharyngeal_endoderm").mkdir(parents=True, exist_ok=True)

FIGURE_FORMAT = "pdf"
(DATA_DIR / "pharyngeal_endoderm" / "results").mkdir(parents=True, exist_ok=True)
Constants#
# fmt: off
S_GENES = [
    "Mcm5", "Pcna", "Tyms", "Fen1", "Mcm2", "Mcm4", "Rrm1", "Ung", "Gins2",
    "Mcm6", "Cdca7", "Dtl", "Prim1", "Uhrf1", "Mlf1ip", "Hells", "Rfc2",
    "Rpa2", "Nasp", "Rad51ap1", "Gmnn", "Wdr76", "Slbp", "Ccne2", "Ubr7",
    "Pold3", "Msh2", "Atad2", "Rad51", "Rrm2", "Cdc45", "Cdc6", "Exo1",
    "Tipin", "Dscc1", "Blm", "Casp8ap2", "Usp1", "Clspn", "Pola1", "Chaf1b",
    "Brip1", "E2f8",
]

G2M_GENES = [
    "Hmgb2", "Cdk1", "Nusap1", "Ube2c", "Birc5", "Tpx2", "Top2a", "Ndc80",
    "Cks2", "Nuf2", "Cks1b", "Mki67", "Tmpo", "Cenpf", "Tacc3", "Fam64a",
    "Smc4", "Ccnb2", "Ckap2l", "Ckap2", "Aurkb", "Bub1", "Kif11", "Anp32e",
    "Tubb4b", "Gtse1", "Kif20b", "Hjurp", "Cdca3", "Hn1", "Cdc20", "Ttk",
    "Cdc25c", "Kif2c", "Rangap1", "Ncapd2", "Dlgap5", "Cdca2", "Cdca8",
    "Ect2", "Kif23", "Hmmr", "Aurka", "Psrc1", "Anln", "Lbr", "Ckap5",
    "Cenpe", "Ctcf", "Nek2", "G2e3", "Gas2l3", "Cbx5", "Cenpa",
]
# fmt: on
Data loading#
adata = sc.read(DATA_DIR / "pharyngeal_endoderm" / "raw" / "adata_pharynx.h5ad")
adata.obsm["X_umap"] = adata.obs[["UMAP1", "UMAP2"]].values
adata.obs["day"] = adata.obs["day_str"].astype(float)
adata.obs = adata.obs[["cluster_name", "day", "is_doublet"]]
adata
AnnData object with n_obs × n_vars = 54044 × 27998
    obs: 'cluster_name', 'day', 'is_doublet'
    obsm: 'X_umap'
Data preprocessing#
sc.pp.highly_variable_genes(adata)
extracting highly variable genes
    finished (0:00:15)
sc.tl.pca(adata)
sc.pp.neighbors(adata, n_pcs=30, n_neighbors=30)
computing PCA
    on highly variable genes
    with n_comps=50
    finished (0:00:03)
computing neighbors
    using 'X_pca' with n_pcs = 30
    finished (0:02:38)
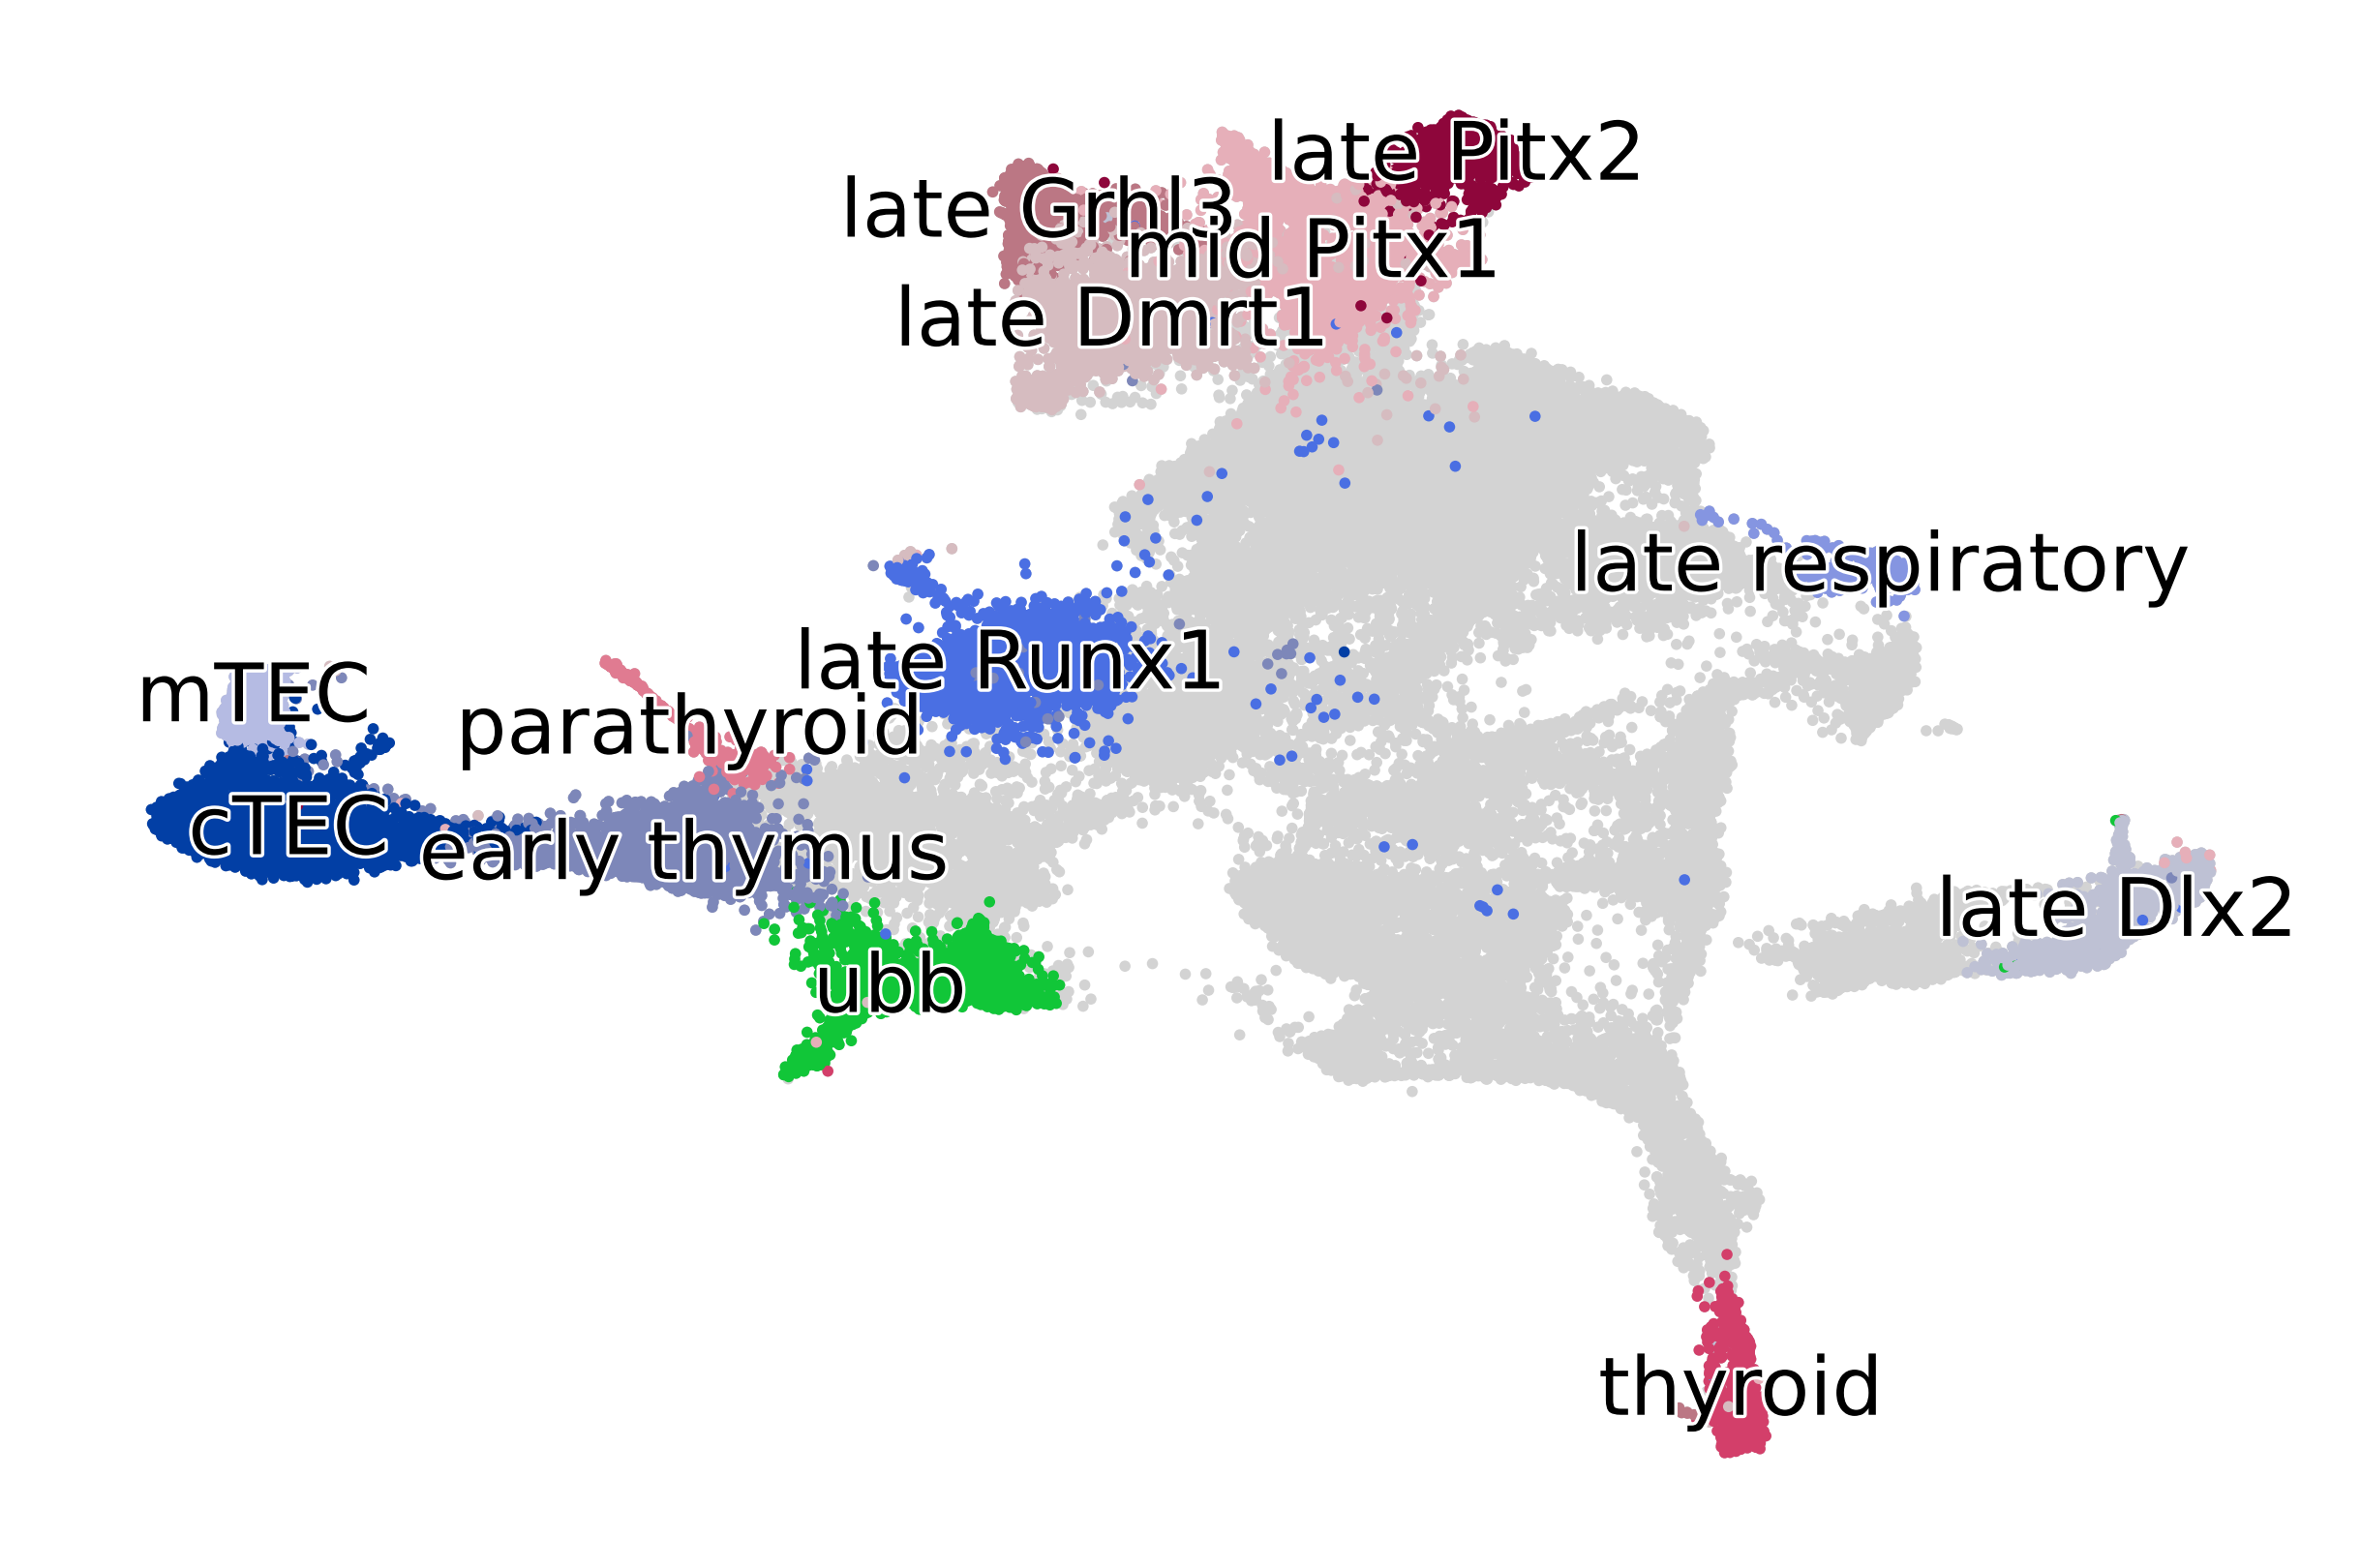
if running_in_notebook():
    scv.pl.scatter(
        adata, basis="umap", c="cluster_name", title="", dpi=250, legend_fontsize=12, legend_fontweight="normal"
    )

if SAVE_FIGURES:
    fig, ax = plt.subplots(figsize=(6, 4))
    scv.pl.scatter(adata, basis="umap", c="cluster_name", legend_loc=False, title="", ax=ax)
    fig.savefig(
        FIG_DIR / "realtime_kernel" / "pharyngeal_endoderm" / f"umap_colored_by_cell_type_full_data.{FIGURE_FORMAT}",
        format=FIGURE_FORMAT,
        transparent=True,
        bbox_inches="tight",
    )

    fig, ax = plt.subplots(figsize=(6, 4))
    scv.pl.scatter(adata, basis="umap", c="day", legend_loc=False, title="", ax=ax)
    fig.savefig(
        FIG_DIR / "realtime_kernel" / "pharyngeal_endoderm" / f"umap_colored_by_day_full_data.{FIGURE_FORMAT}",
        format=FIGURE_FORMAT,
        transparent=True,
        bbox_inches="tight",
    )
CellRank#
Kernel#
if not (DATA_DIR / "pharyngeal_endoderm" / "tmaps_full_data").exists():
    ot_model = wot.ot.OTModel(adata)
    ot_model.compute_all_transport_maps(tmap_out=DATA_DIR / "pharyngeal_endoderm" / "tmaps_full_data" / "tmaps")
adata.obs["day"] = adata.obs["day"].astype("category")

rtk = cr.kernels.RealTimeKernel.from_wot(
    adata, path=DATA_DIR / "pharyngeal_endoderm" / "tmaps_full_data", time_key="day"
)
rtk.compute_transition_matrix(
    growth_iters=3, growth_rate_key="growth_rate_init", self_transitions="all", conn_weight=0.1
)
WARNING: Your filename has more than two extensions: ['.5_11', '.5', '.h5ad'].
Only considering the two last: ['.5', '.h5ad'].
WARNING: Your filename has more than two extensions: ['.5_11', '.5', '.h5ad'].
Only considering the two last: ['.5', '.h5ad'].
WARNING: Your filename has more than two extensions: ['.5_12', '.5', '.h5ad'].
Only considering the two last: ['.5', '.h5ad'].
WARNING: Your filename has more than two extensions: ['.5_12', '.5', '.h5ad'].
Only considering the two last: ['.5', '.h5ad'].
WARNING: Your filename has more than two extensions: ['.5_10', '.5', '.h5ad'].
Only considering the two last: ['.5', '.h5ad'].
WARNING: Your filename has more than two extensions: ['.5_10', '.5', '.h5ad'].
Only considering the two last: ['.5', '.h5ad'].
Using automatic `threshold=0.0022490203846246004`
computing neighbors
    using 'X_pca' with n_pcs = 50
    finished (0:00:02)
computing neighbors
    using 'X_pca' with n_pcs = 50
    finished (0:00:02)
computing neighbors
    using 'X_pca' with n_pcs = 50
    finished (0:00:02)
computing neighbors
    using 'X_pca' with n_pcs = 50
    finished (0:00:01)
RealTimeKernel[n=54044, growth_iters=3, growth_rate_key='growth_rate_init', threshold='auto', self_transitions='all']
Estimator#
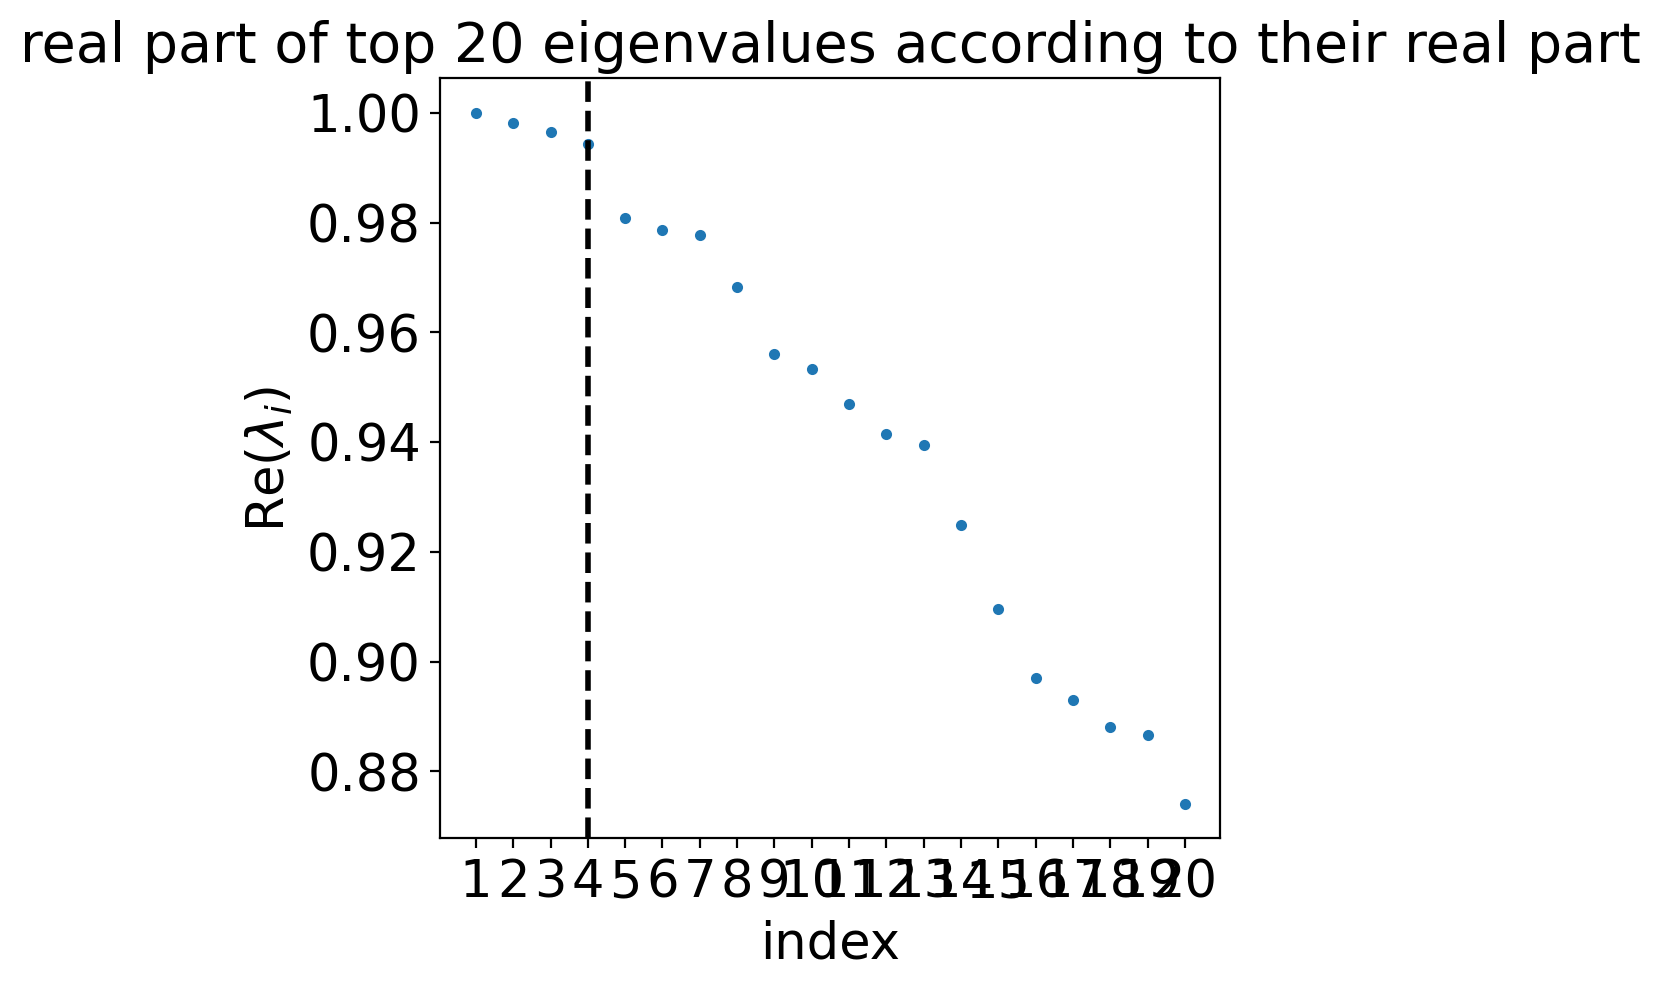
estimator = cr.estimators.GPCCA(rtk)
estimator.compute_schur(n_components=20)
estimator.plot_spectrum(real_only=True)
plt.show()
Computing Schur decomposition
Adding `adata.uns['eigendecomposition_fwd']`
       `.schur_vectors`
       `.schur_matrix`
       `.eigendecomposition`
    Finish (0:00:04)
terminal_states = [
"late_Dlx2",
"late_Runx1",
"parathyroid",
"cTEC",
"mTEC",
"late_Grhl3",
"late_Pitx2",
"ubb",
"thyroid",
"late_Dmrt1",
"late_respiratory",
]
cluster_key = "cluster_name"
if (DATA_DIR / "pharyngeal_endoderm" / "results" / "tsi-full_data-rtk.csv").is_file():
tsi_df = pd.read_csv(DATA_DIR / "pharyngeal_endoderm" / "results" / "tsi-full_data-rtk.csv")
estimator._tsi = AnnData(tsi_df, uns={"terminal_states": terminal_states, "cluster_key": cluster_key})
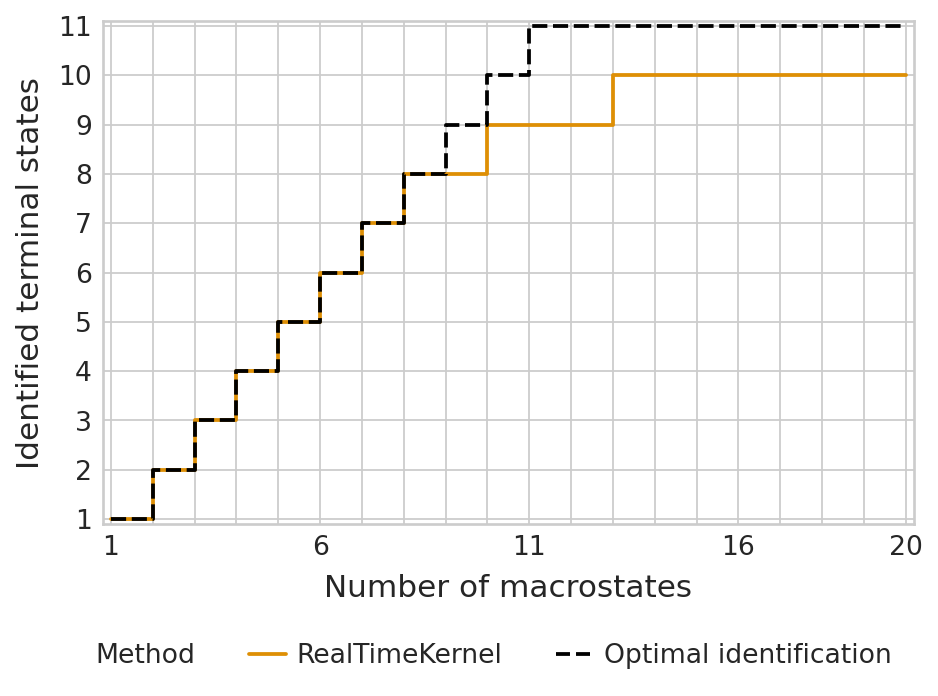
tsi_score = estimator.tsi(n_macrostates=20, terminal_states=terminal_states, cluster_key=cluster_key)
else:
tsi_score = estimator.tsi(n_macrostates=20, terminal_states=terminal_states, cluster_key=cluster_key)
estimator._tsi.to_df().to_csv(DATA_DIR / "pharyngeal_endoderm" / "results" / "tsi-full_data-rtk.csv", index=False)
print(f"TSI score: {tsi_score:.2f}")
TSI score: 0.92
/vol/storage/miniconda3/envs/cr2-py38/lib/python3.8/site-packages/anndata/_core/anndata.py:121: ImplicitModificationWarning: Transforming to str index.
  warnings.warn("Transforming to str index.", ImplicitModificationWarning)
palette = {"RealTimeKernel": "#DE8F05", "Optimal identification": "#000000"}

if SAVE_FIGURES:
    fpath = FIG_DIR / "realtime_kernel" / "pharyngeal_endoderm" / f"tsi-full_data-rtk.{FIGURE_FORMAT}"
else:
    fpath = None

with mplscience.style_context():
    sns.set_style(style="whitegrid")
    estimator.plot_tsi(palette=palette, save=fpath)
    plt.show()
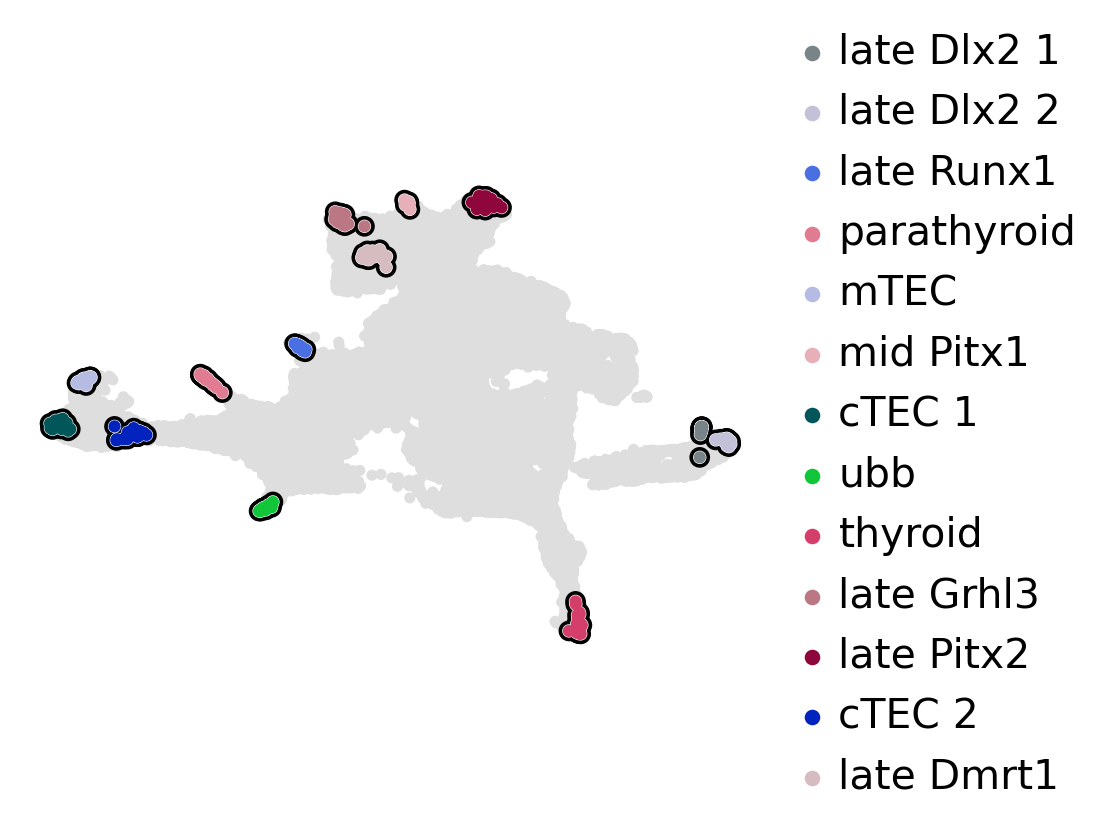
estimator.compute_macrostates(n_states=13, cluster_key="cluster_name")
if running_in_notebook():
    estimator.plot_macrostates(which="all", basis="umap", title="", legend_loc="right", size=100)
    if SAVE_FIGURES:
        fpath = (
            FIG_DIR
            / "realtime_kernel"
            / "pharyngeal_endoderm"
            / f"umap_colored_by_macrostates_full_data.{FIGURE_FORMAT}"
        )
        estimator.plot_macrostates(which="all", basis="umap", title="", legend_loc=False, size=100, save=fpath)
Computing `13` macrostates
DEBUG: Setting the macrostates using macrostates memberships
DEBUG: Raising an exception if there are less than `6` cells.
Adding `.macrostates`
       `.macrostates_memberships`
       `.coarse_T`
       `.coarse_initial_distribution
       `.coarse_stationary_distribution`
       `.schur_vectors`
       `.schur_matrix`
       `.eigendecomposition`
    Finish (0:01:59)
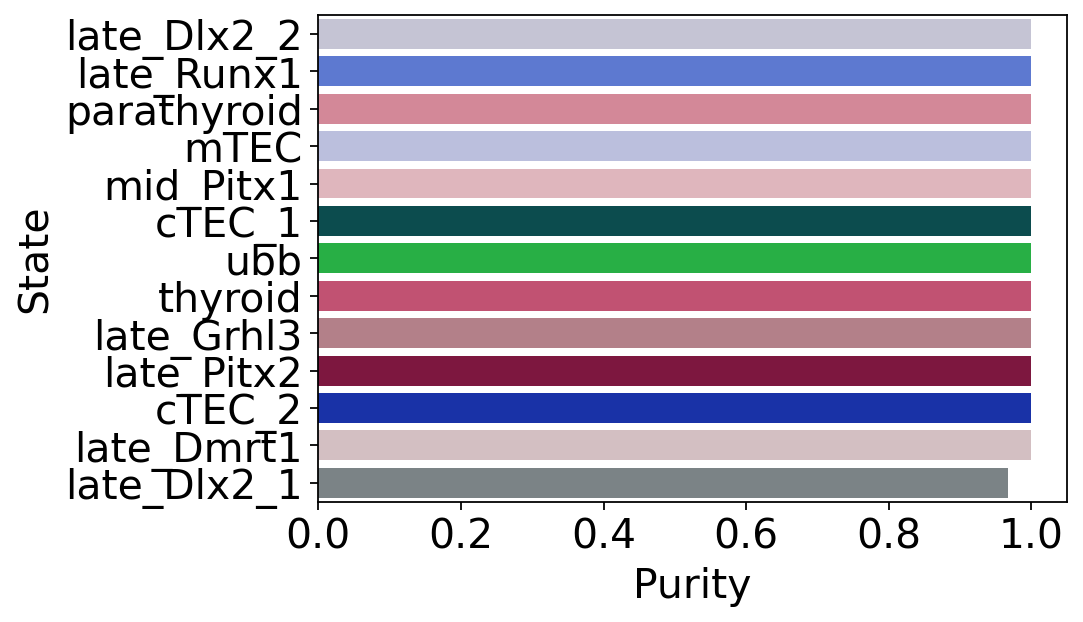
macrostate_purity = get_state_purity(adata, estimator, states="macrostates", obs_col="cluster_name")
print(f"Mean purity: {np.mean(list(macrostate_purity.values()))}")

if running_in_notebook():
    if SAVE_FIGURES:
        fpath = FIG_DIR / "realtime_kernel" / "pharyngeal_endoderm" / f"macrostate_purity_full_data.{FIGURE_FORMAT}"
    else:
        fpath = None

    palette = dict(zip(estimator.macrostates.cat.categories, estimator._macrostates.colors))

    plot_state_purity(macrostate_purity, palette=palette, fpath=fpath, format=FIGURE_FORMAT)
    plt.show()
Mean purity: 0.9974358974358974
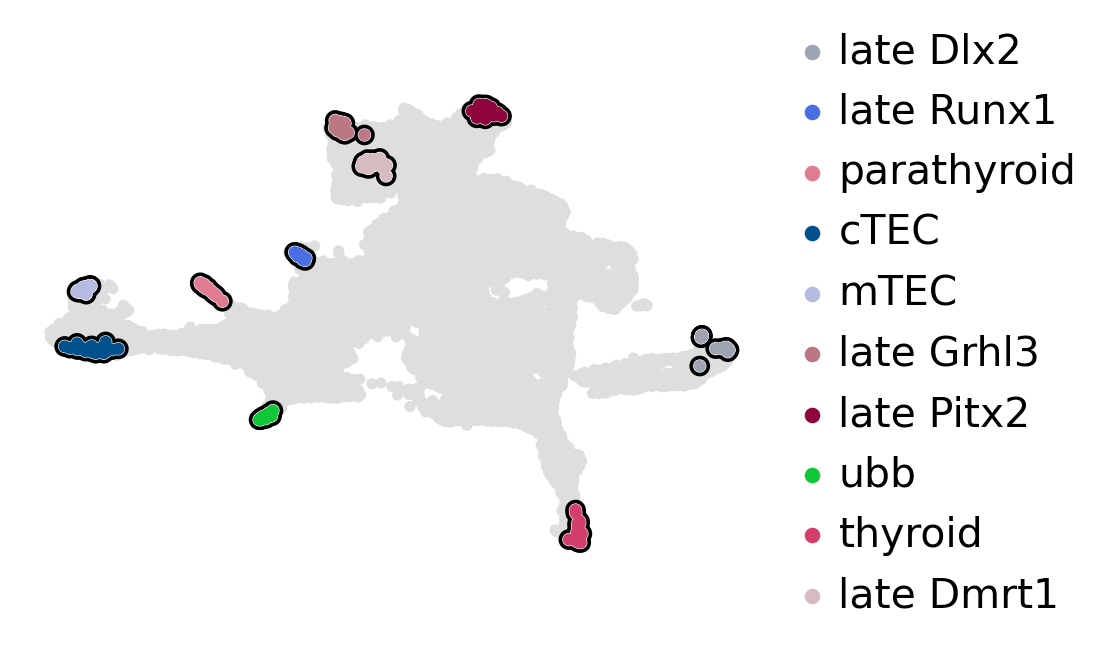
estimator.set_terminal_states(
    [
        "late_Dlx2_1, late_Dlx2_2",
        "late_Runx1",
        "parathyroid",
        "cTEC_1, cTEC_2",
        "mTEC",
        "late_Grhl3",
        "late_Pitx2",
        "ubb",
        "thyroid",
        "late_Dmrt1",
    ]
)

estimator.rename_terminal_states({"cTEC_1, cTEC_2": "cTEC", "late_Dlx2_1, late_Dlx2_2": "late_Dlx2"})

if running_in_notebook():
    estimator.plot_macrostates(which="terminal", basis="umap", title="", legend_loc="right", size=100)
    if SAVE_FIGURES:
        fpath = (
            FIG_DIR
            / "realtime_kernel"
            / "pharyngeal_endoderm"
            / f"umap_colored_by_terminal_states_full_data.{FIGURE_FORMAT}"
        )
        estimator.plot_macrostates(which="terminal", basis="umap", title="", legend_loc=False, size=100, save=fpath)
DEBUG: Raising an exception if there are less than `6` cells.
Adding `adata.obs['term_states_fwd']`
       `adata.obs['term_states_fwd_probs']`
       `.terminal_states`
       `.terminal_states_probabilities`
       `.terminal_states_memberships
    Finish`
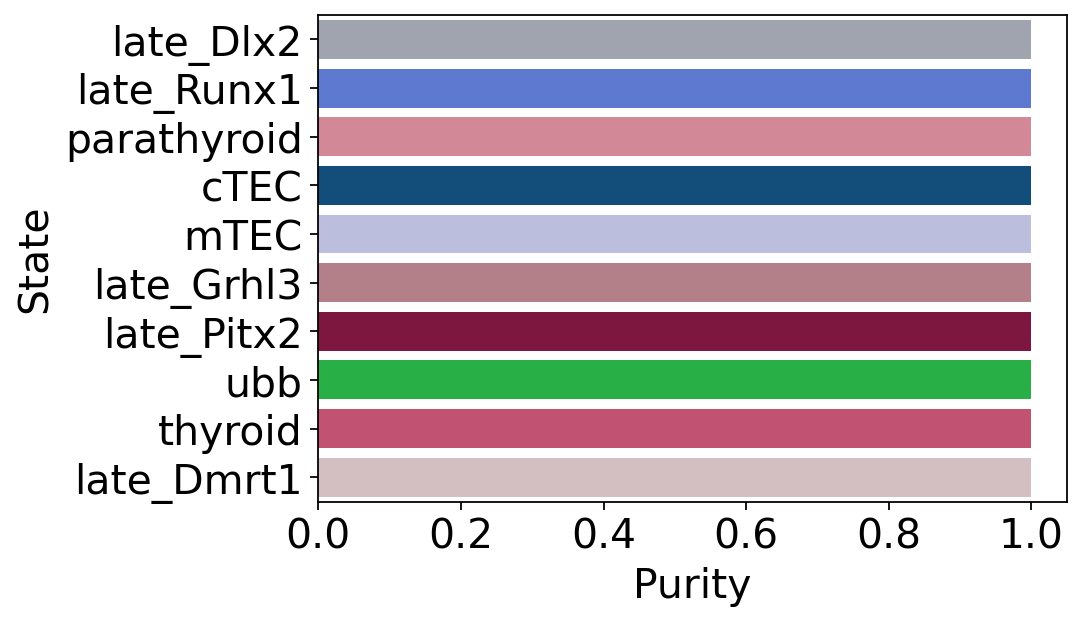
terminal_state_purity = get_state_purity(adata, estimator, states="terminal_states", obs_col="cluster_name")
print(f"Mean purity: {np.mean(list(terminal_state_purity.values()))}")

if running_in_notebook():
    if SAVE_FIGURES:
        fpath = (
            FIG_DIR / "realtime_kernel" / "pharyngeal_endoderm" / f"terminal_states_purity_full_data.{FIGURE_FORMAT}"
        )
    else:
        fpath = None

    palette = dict(zip(estimator.terminal_states.cat.categories, estimator._term_states.colors))

    plot_state_purity(terminal_state_purity, palette=palette, fpath=fpath, format=FIGURE_FORMAT)
    plt.show()
Mean purity: 1.0
estimator.compute_fate_probabilities(solver="gmres", use_petsc=True)
Computing fate probabilities
DEBUG: Solving the linear system using `PETSc` solver `'gmres'` on `1` core(s) with no preconditioner and `tol=1e-06`
Adding `adata.obsm['lineages_fwd']`
       `.fate_probabilities`
    Finish (0:00:03)
[0]PETSC ERROR: ------------------------------------------------------------------------
[0]PETSC ERROR: Caught signal number 13 Broken Pipe: Likely while reading or writing to a socket
[0]PETSC ERROR: Try option -start_in_debugger or -on_error_attach_debugger
[0]PETSC ERROR: or see https://petsc.org/release/faq/#valgrind and https://petsc.org/release/faq/
[0]PETSC ERROR: configure using --with-debugging=yes, recompile, link, and run
[0]PETSC ERROR: to get more information on the crash.
Abort(59) on node 0 (rank 0 in comm 0): application called MPI_Abort(MPI_COMM_WORLD, 59) - process 0
estimator.compute_fate_probabilities()
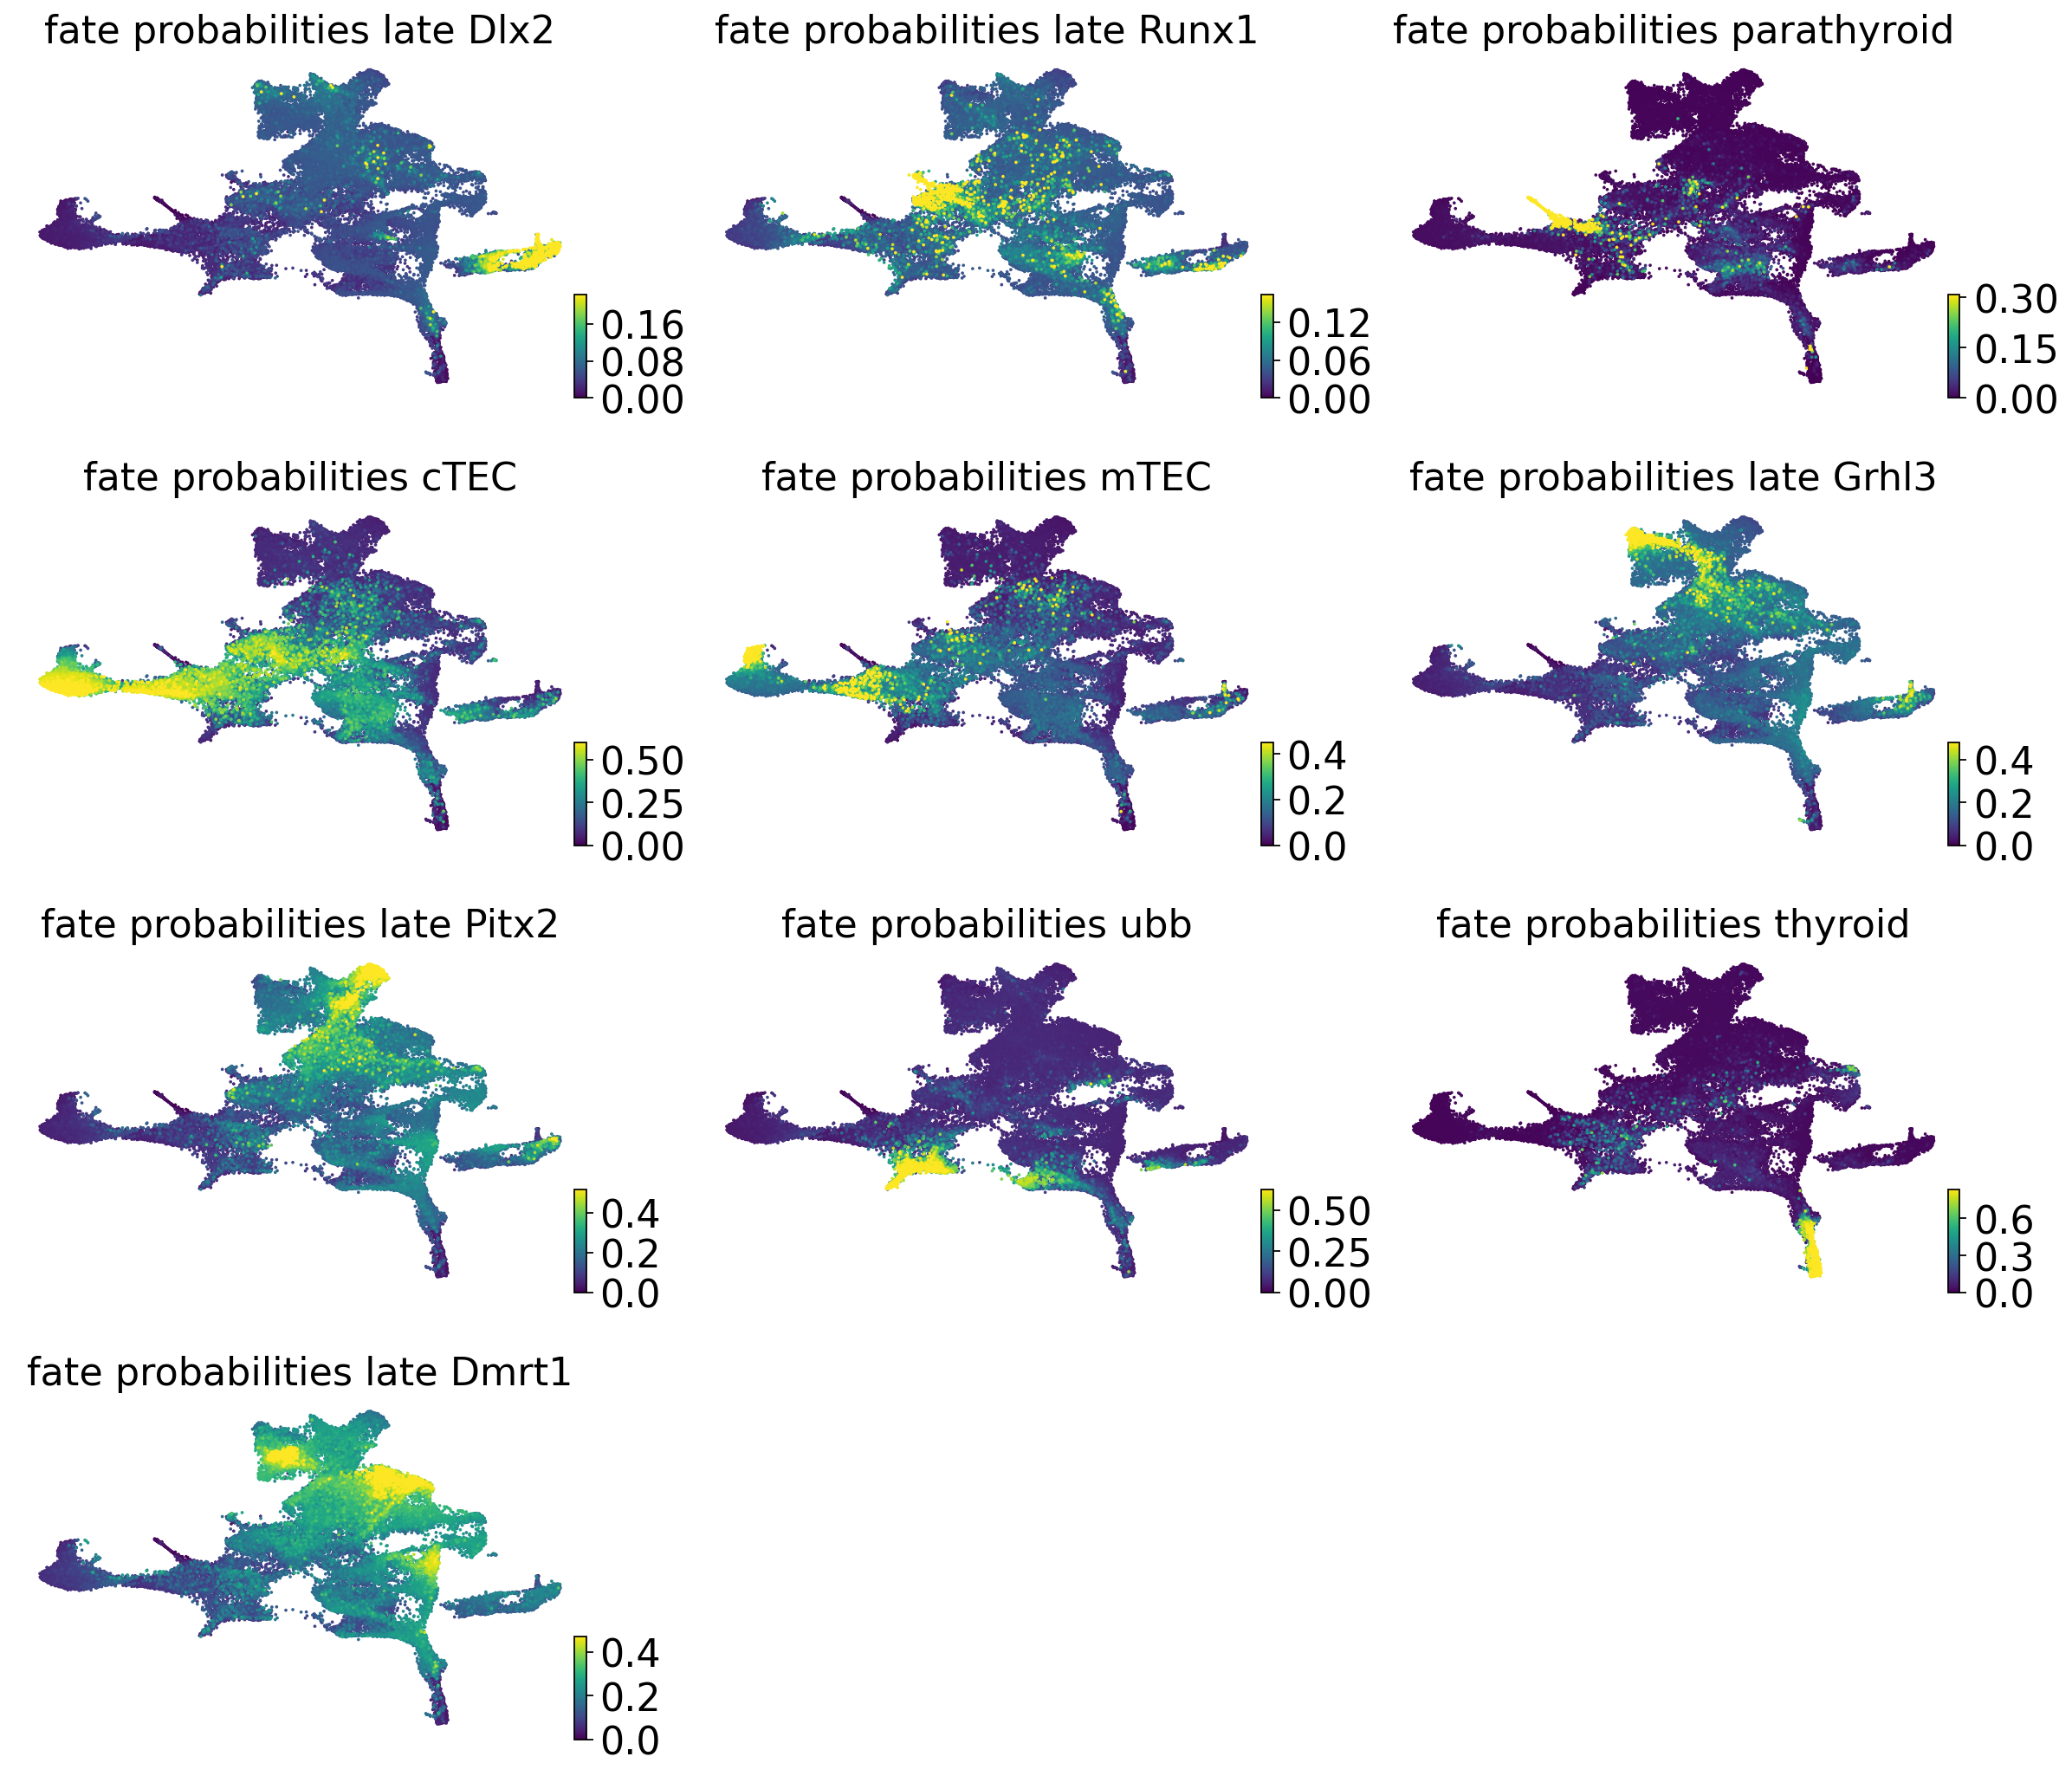
if running_in_notebook():
estimator.plot_fate_probabilities(same_plot=False, basis="umap", perc=[0, 99], ncols=3)
if SAVE_FIGURES:
for terminal_state in estimator.terminal_states.cat.categories:
adata.obs[f"fate_prob_{terminal_state}"] = adata.obsm["lineages_fwd"][:, terminal_state].X.squeeze()
fig, ax = plt.subplots(figsize=(6, 4))
if running_in_notebook():
scv.pl.scatter(
adata,
basis="umap",
color=f"fate_prob_{terminal_state}",
cmap="viridis",
title="",
colorbar=False,
ax=ax,
)
fig.savefig(
FIG_DIR
/ "realtime_kernel"
/ "pharyngeal_endoderm"
/ f"fate_prob_{terminal_state}_full_data.{FIGURE_FORMAT}",
format=FIGURE_FORMAT,
transparent=True,
bbox_inches="tight",
)
Computing fate probabilities
DEBUG: Solving the linear system using `PETSc` solver `'gmres'` on `1` core(s) with no preconditioner and `tol=1e-06`
Adding `adata.obsm['lineages_fwd']`
       `.fate_probabilities`
    Finish (0:00:03)
[0]PETSC ERROR: ------------------------------------------------------------------------
[0]PETSC ERROR: Caught signal number 13 Broken Pipe: Likely while reading or writing to a socket
[0]PETSC ERROR: Try option -start_in_debugger or -on_error_attach_debugger
[0]PETSC ERROR: or see https://petsc.org/release/faq/#valgrind and https://petsc.org/release/faq/
[0]PETSC ERROR: configure using --with-debugging=yes, recompile, link, and run
[0]PETSC ERROR:
Driver analysis#
adata.obs["cluster_name_"] = adata.obs["cluster_name"].copy().astype(str).astype("category")
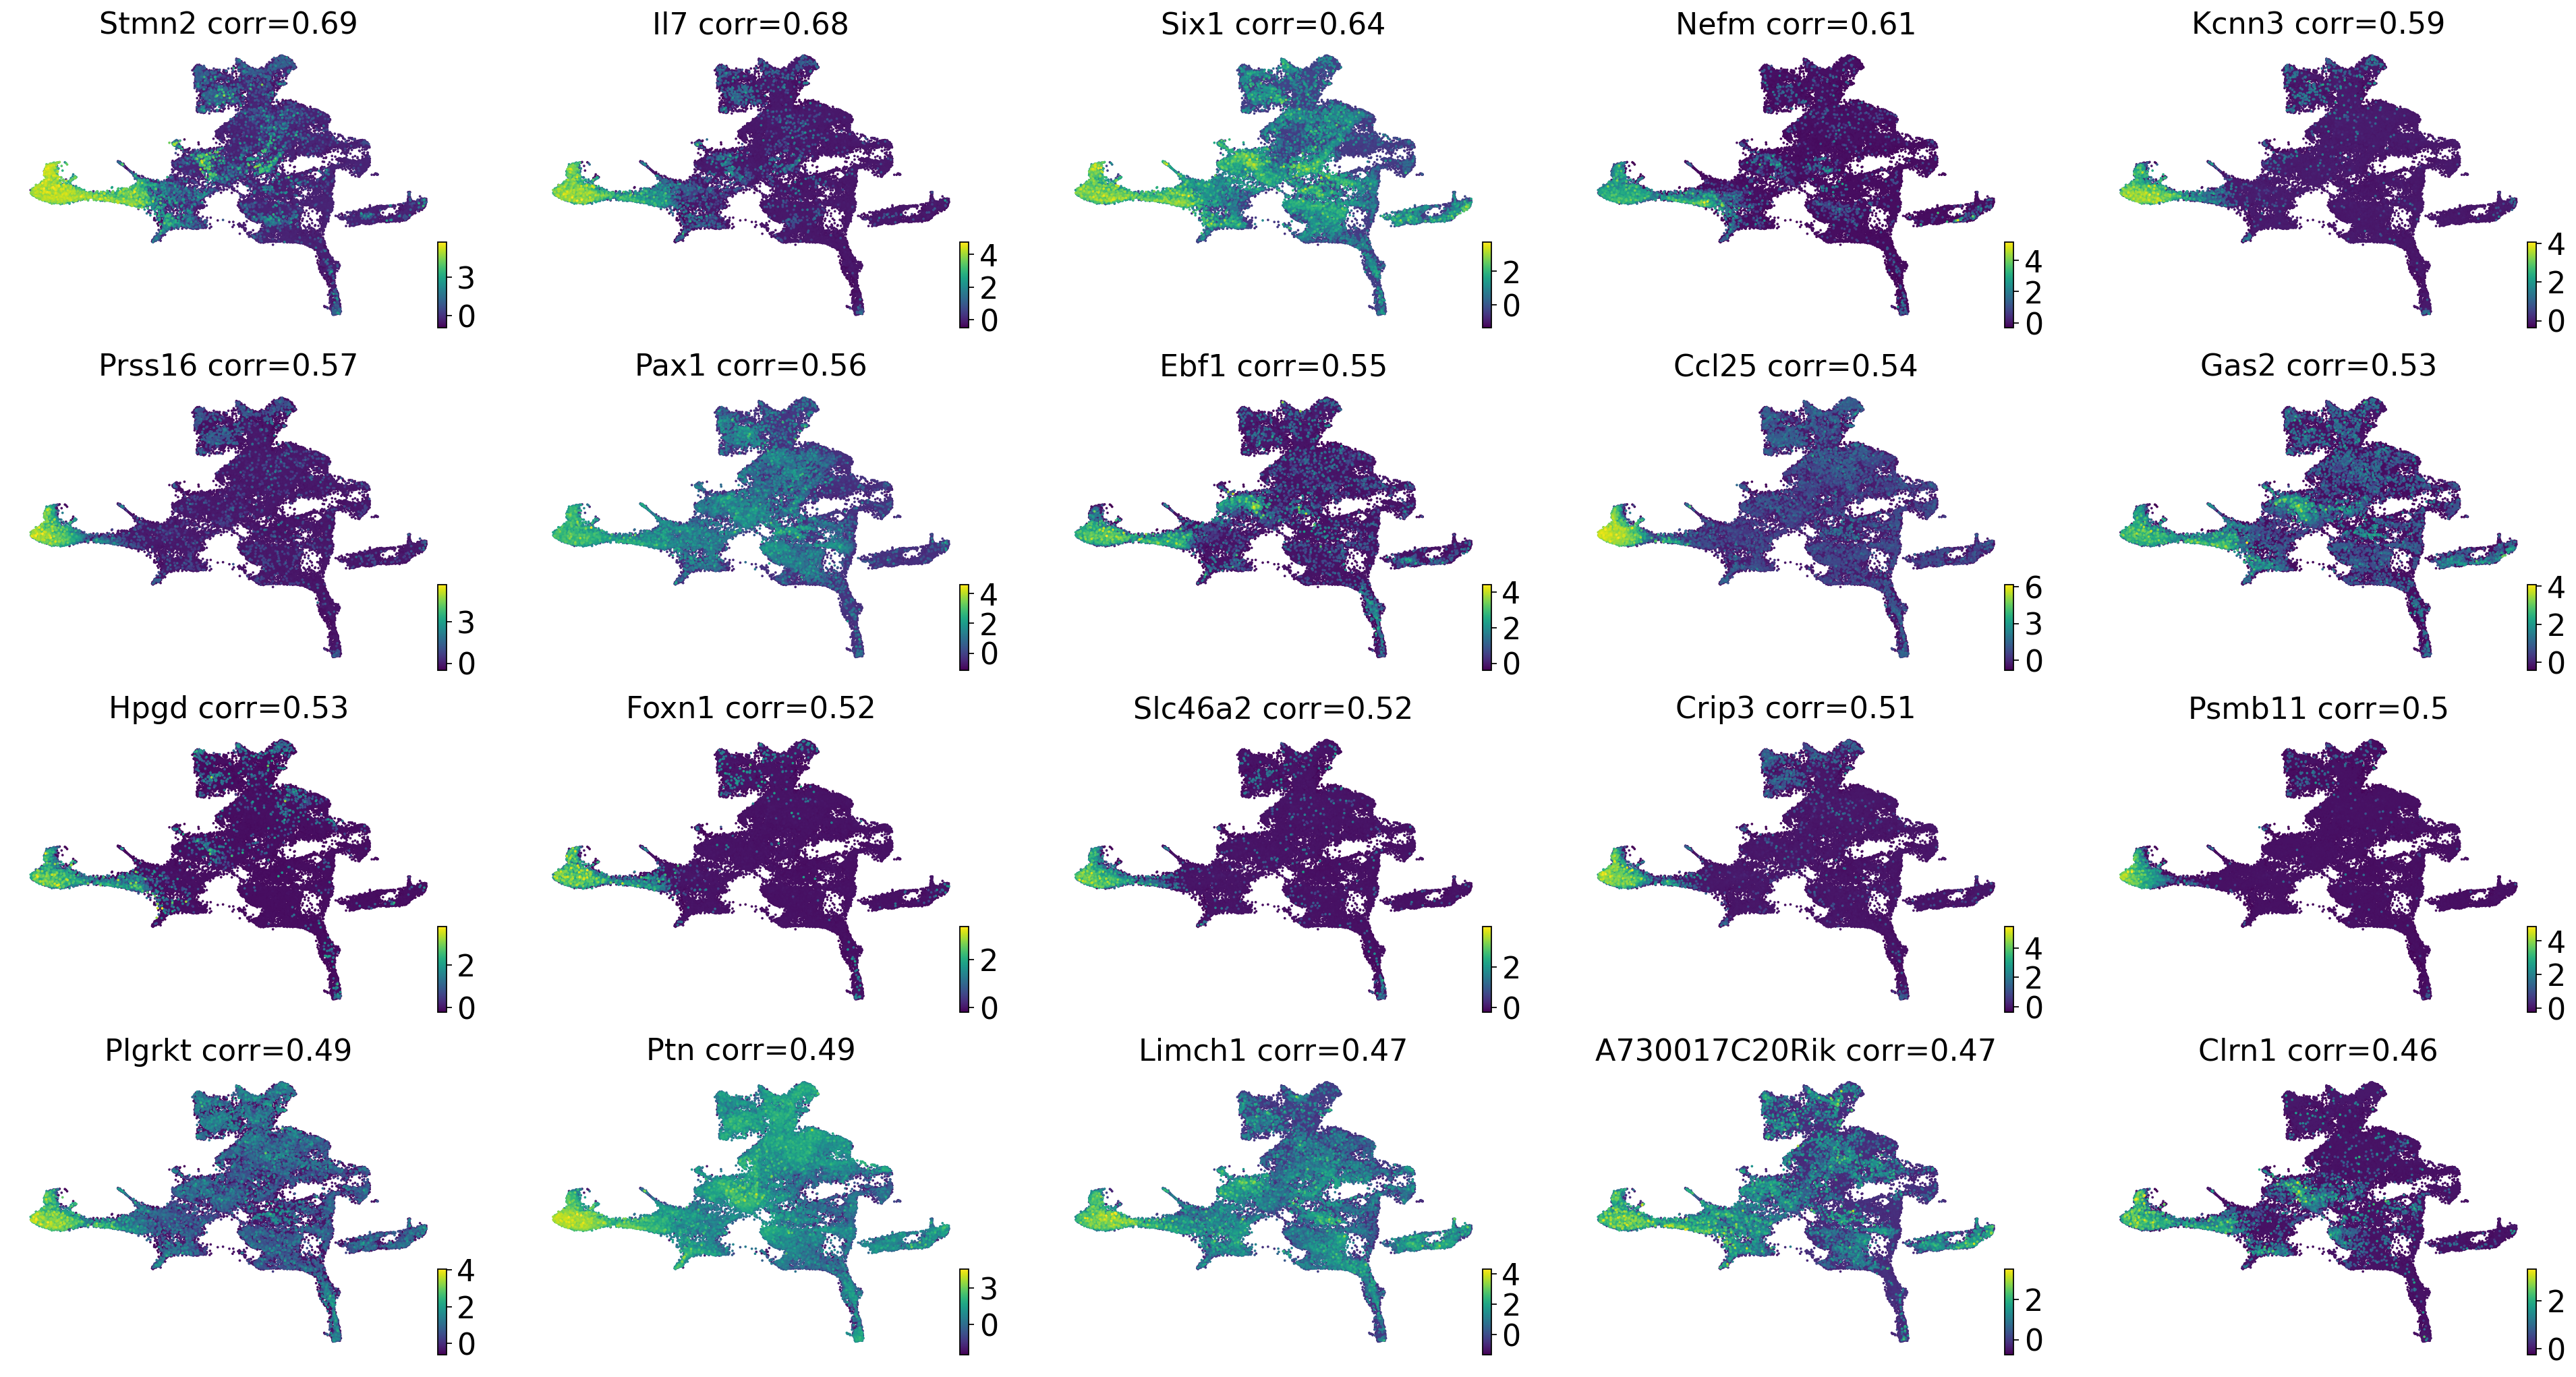
drivers_ctec = estimator.compute_lineage_drivers(
    return_drivers=True, cluster_key="cluster_name_", lineages=["cTEC"], clusters=["nan", "early_thymus", "cTEC"]
)

gene_names = drivers_ctec.loc[
    ~(
        drivers_ctec.index.str.startswith(("mt.", "Rpl", "Rps", "^Hb[^(p)]"))
        | drivers_ctec.index.isin(S_GENES + G2M_GENES)
    ),
    :,
].index

if running_in_notebook():
    estimator.plot_lineage_drivers(lineage="cTEC", n_genes=20, ncols=5, title_fmt="{gene} corr={corr:.2}")

    if SAVE_FIGURES:
        fig, ax = plt.subplots(figsize=(6, 4))
        scv.pl.scatter(
            adata, basis="umap", c="Foxn1", cmap="viridis", title="", legend_loc=None, colorbar=False, ax=ax, s=25
        )
        fig.savefig(
            FIG_DIR / "realtime_kernel" / "pharyngeal_endoderm" / f"umap_colored_by_foxn1_full_data.{FIGURE_FORMAT}",
            format=FIGURE_FORMAT,
            transparent=True,
            bbox_inches="tight",
        )

np.where(gene_names == "Foxn1")
DEBUG: Computing correlations for lineages `['cTEC']` restricted to clusters `['nan', 'early_thymus', 'cTEC']` in layer `X` with `use_raw=False`
Adding `adata.varm['terminal_lineage_drivers']`
       `.lineage_drivers`
    Finish (0:00:09)
(array([11]),)
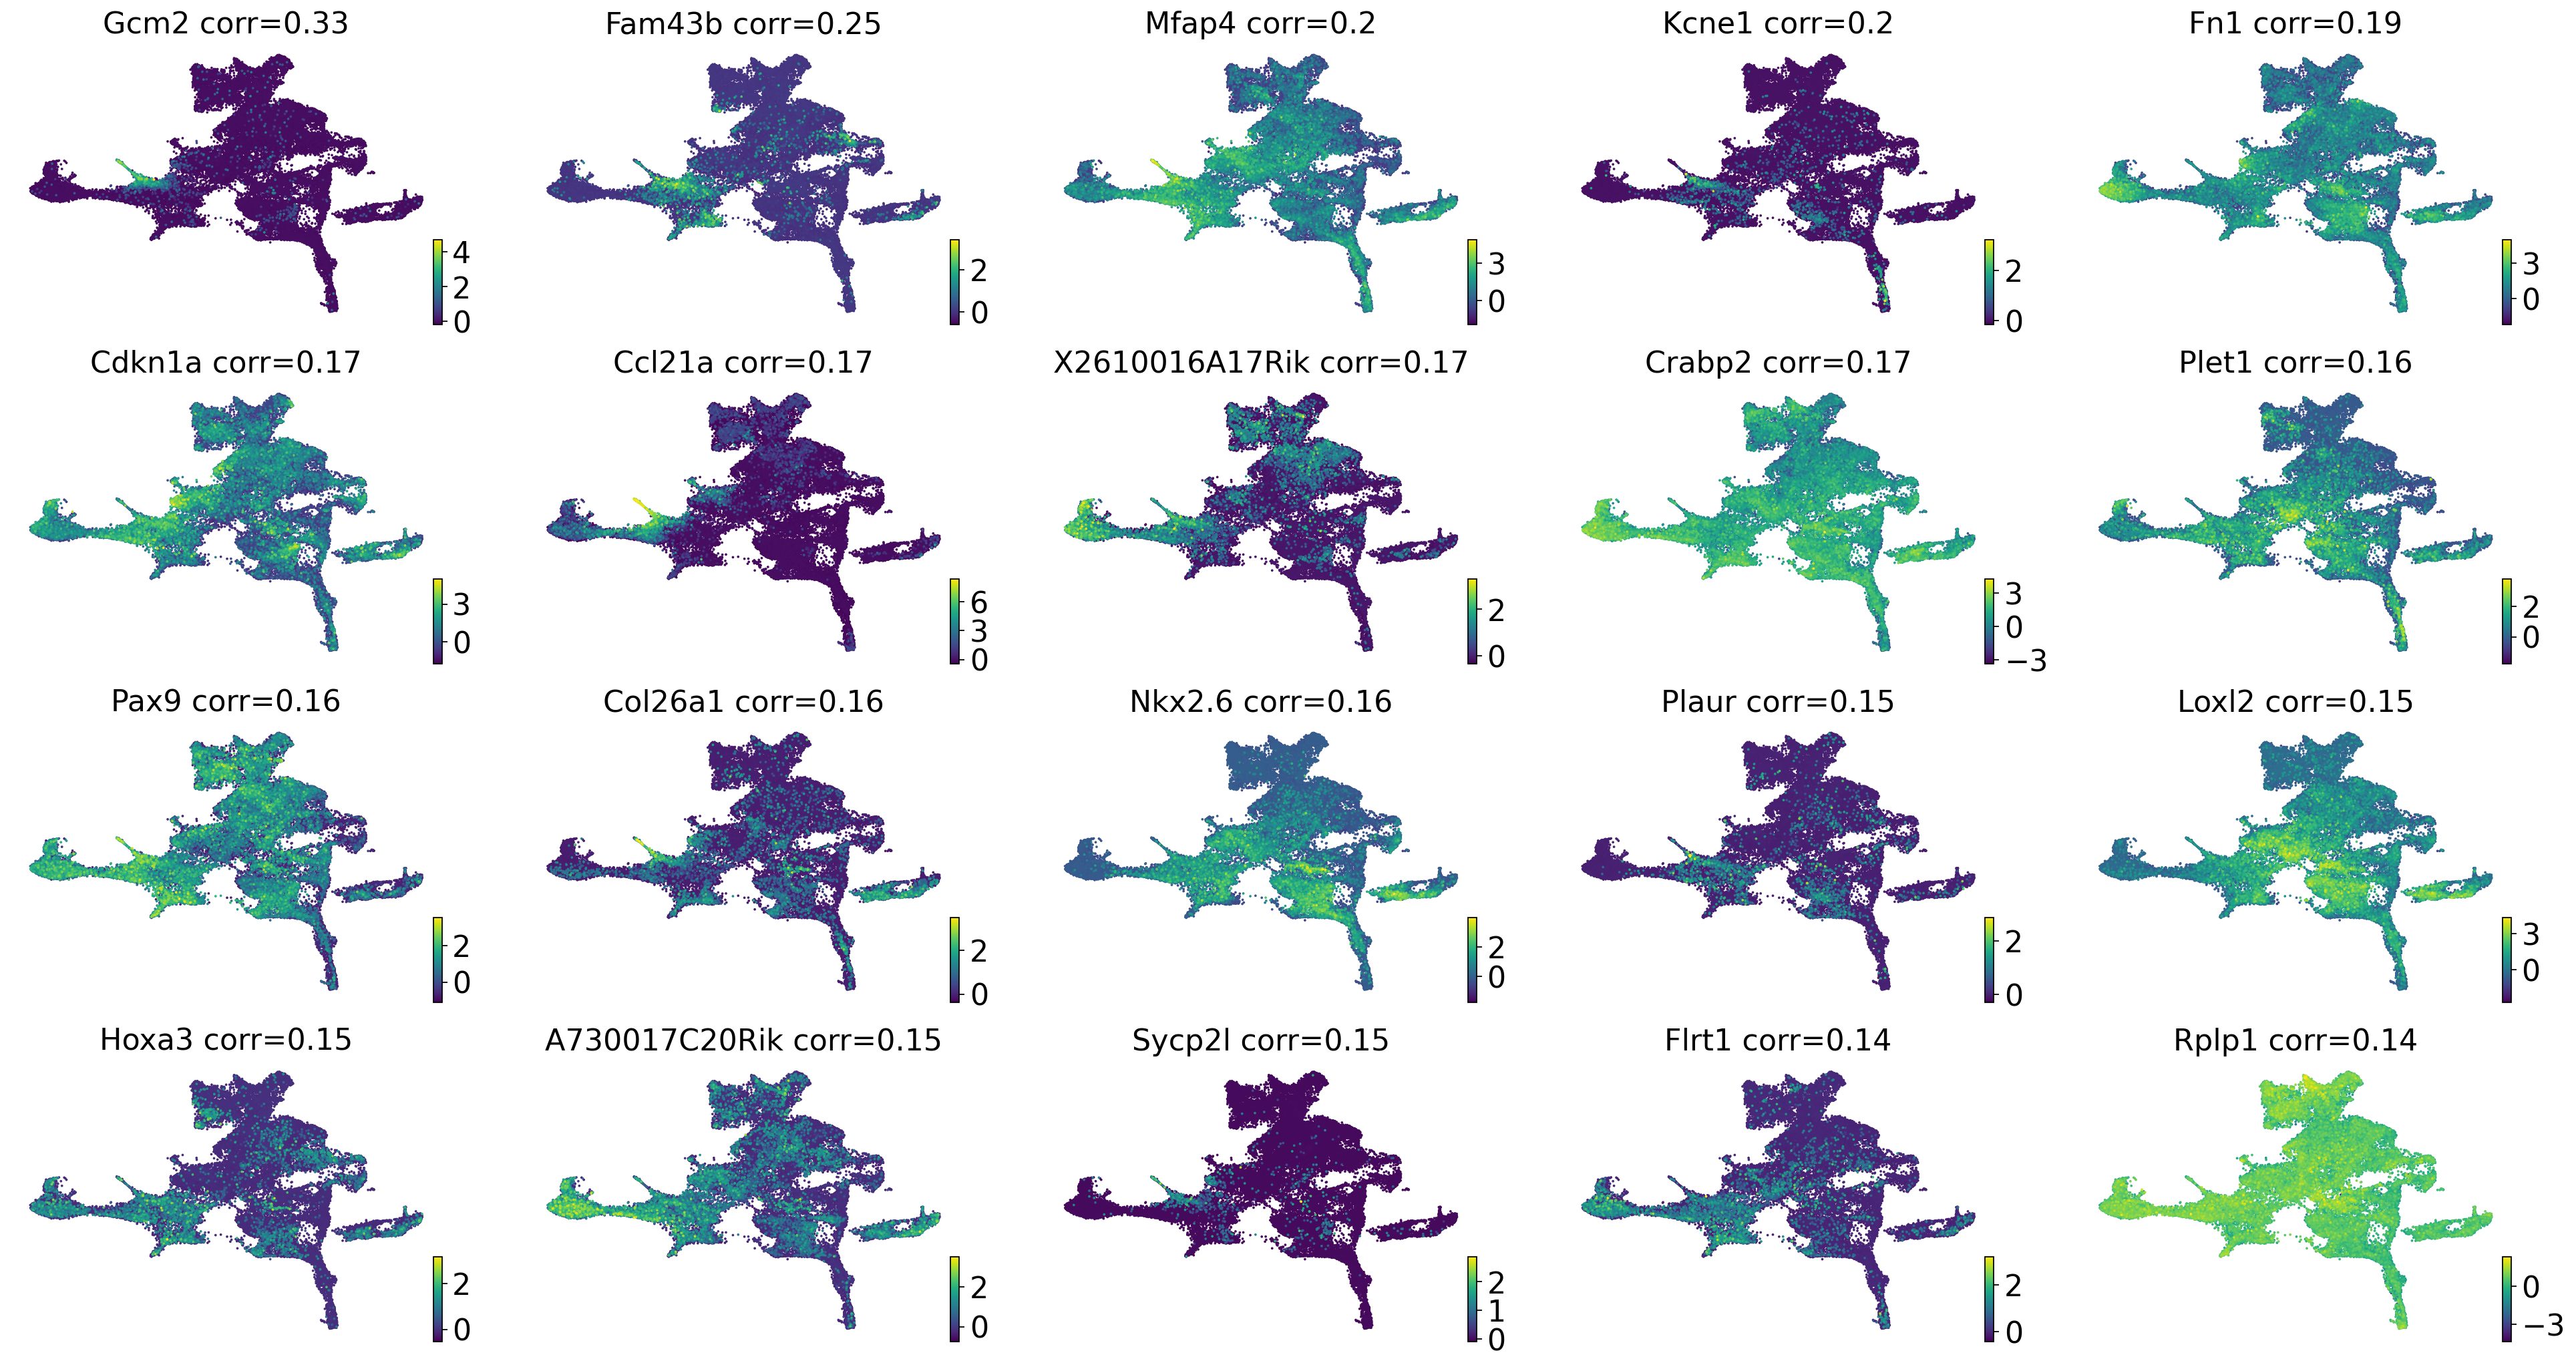
drivers_parathyroid = estimator.compute_lineage_drivers(
    return_drivers=True, cluster_key="cluster_name_", lineages=["parathyroid"], clusters=["nan"]
)

gene_names = drivers_parathyroid.loc[
    ~(
        drivers_parathyroid.index.str.startswith(("mt.", "Rpl", "Rps", "^Hb[^(p)]"))
        | drivers_parathyroid.index.isin(S_GENES + G2M_GENES)
    ),
    :,
].index

if running_in_notebook():
    estimator.plot_lineage_drivers(lineage="parathyroid", n_genes=20, ncols=5, title_fmt="{gene} corr={corr:.2}")

    if SAVE_FIGURES:
        fig, ax = plt.subplots(figsize=(6, 4))
        scv.pl.scatter(
            adata, basis="umap", c="Gcm2", cmap="viridis", title="", legend_loc=None, colorbar=False, ax=ax, s=25
        )
        fig.savefig(
            FIG_DIR / "realtime_kernel" / "pharyngeal_endoderm" / f"umap_colored_by_gcm2_full_data.{FIGURE_FORMAT}",
            format=FIGURE_FORMAT,
            transparent=True,
            bbox_inches="tight",
        )

np.where(gene_names == "Gcm2")
DEBUG: Computing correlations for lineages `['parathyroid']` restricted to clusters `['nan']` in layer `X` with `use_raw=False`
Adding `adata.varm['terminal_lineage_drivers']`
       `.lineage_drivers`
    Finish (0:00:07)
(array([0]),)
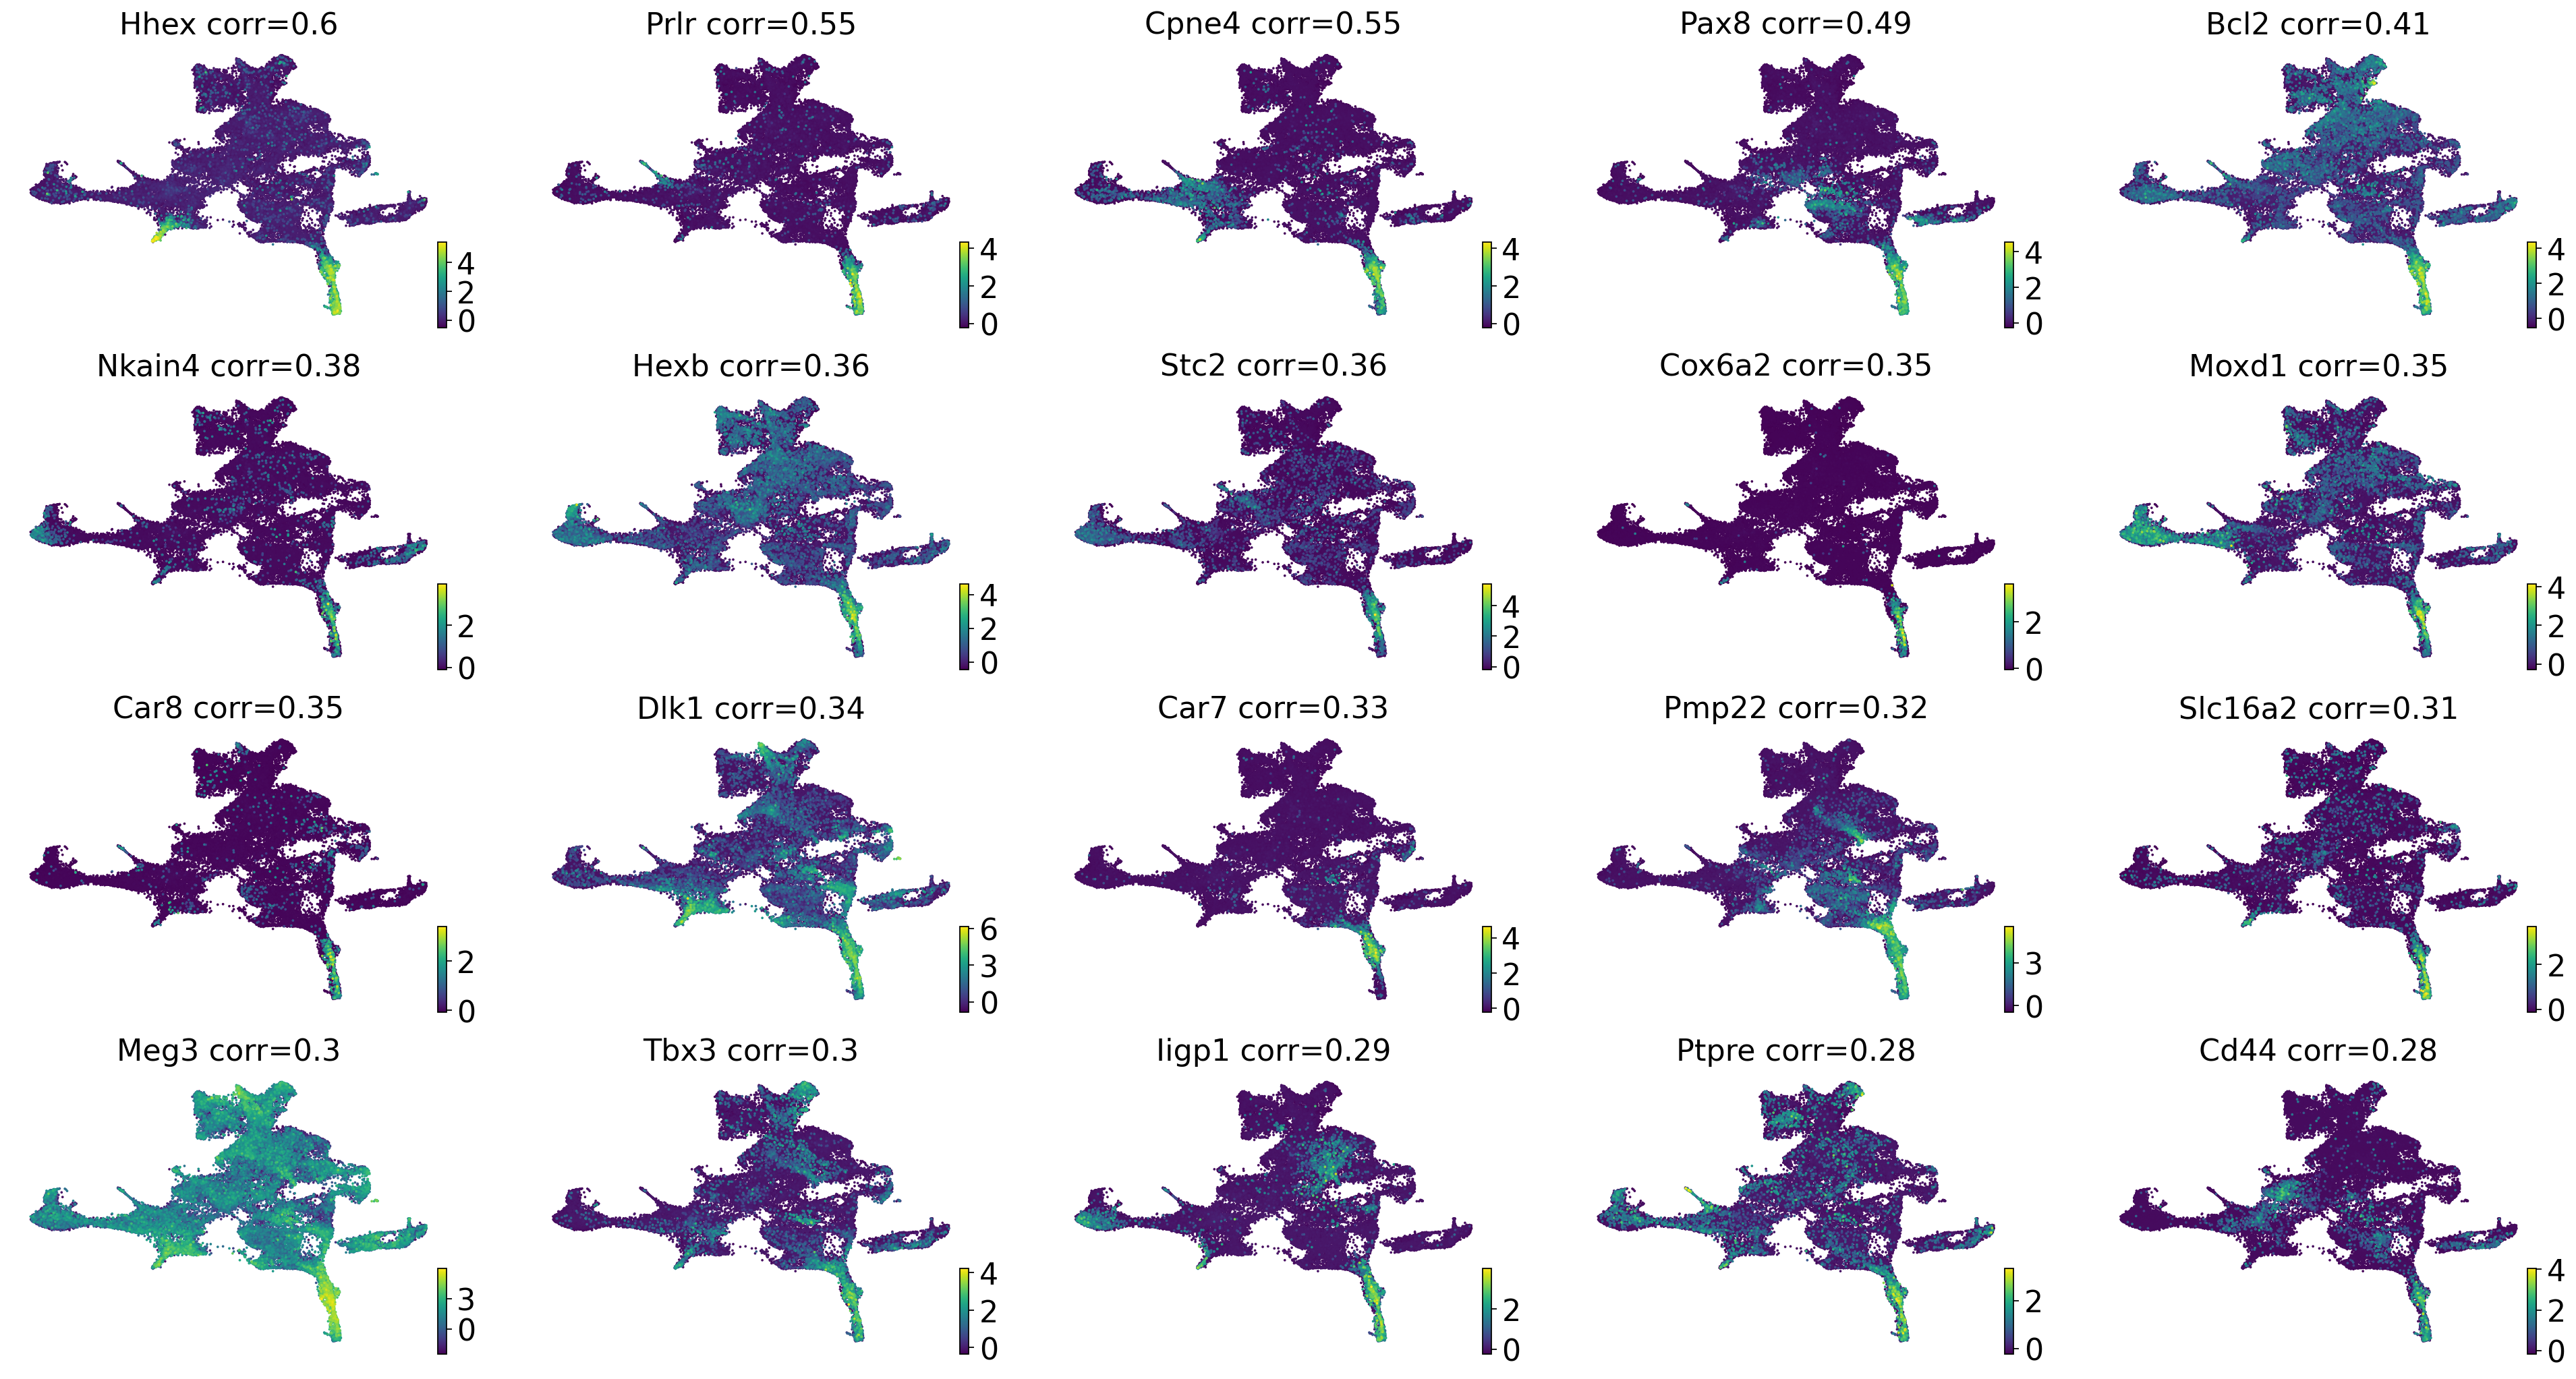
drivers_thyroid = estimator.compute_lineage_drivers(
    return_drivers=True, cluster_key="cluster_name_", lineages=["thyroid"], clusters=["nan"]
)

gene_names = drivers_thyroid.loc[
    ~(
        drivers_thyroid.index.str.startswith(("mt.", "Rpl", "Rps", "^Hb[^(p)]"))
        | drivers_thyroid.index.isin(S_GENES + G2M_GENES)
    ),
    :,
].index

if running_in_notebook():
    estimator.plot_lineage_drivers(lineage="thyroid", n_genes=20, ncols=5, title_fmt="{gene} corr={corr:.2}")

    if SAVE_FIGURES:
        fig, ax = plt.subplots(figsize=(6, 4))
        scv.pl.scatter(
            adata, basis="umap", c="Hhex", cmap="viridis", title="", legend_loc=None, colorbar=False, ax=ax, s=25
        )
        fig.savefig(
            FIG_DIR / "realtime_kernel" / "pharyngeal_endoderm" / f"umap_colored_by_hhex_full_data.{FIGURE_FORMAT}",
            format=FIGURE_FORMAT,
            transparent=True,
            bbox_inches="tight",
        )

np.where(gene_names == "Hhex")
DEBUG: Computing correlations for lineages `['thyroid']` restricted to clusters `['nan']` in layer `X` with `use_raw=False`
Adding `adata.varm['terminal_lineage_drivers']`
       `.lineage_drivers`
    Finish (0:00:07)
(array([0]),)