Pharyngeal endoderm development analysis with RealTimeKernel#
Import packages#
import sys

import numpy as np
import pandas as pd

import matplotlib.pyplot as plt
import mplscience
import seaborn as sns

import cellrank as cr
import scanpy as sc
import scvelo as scv
import wot
from anndata import AnnData

from cr2 import get_state_purity, plot_state_purity, running_in_notebook

sys.path.extend(["../../../", "."])
from paths import DATA_DIR, FIG_DIR  # isort: skip  # noqa: E402
Global seed set to 0
General settings#
sc.settings.verbosity = 2
cr.settings.verbosity = 4
scv.settings.verbosity = 3
scv.settings.set_figure_params("scvelo", dpi_save=400, dpi=80, transparent=True, fontsize=20, color_map="viridis")
SAVE_FIGURES = False
if SAVE_FIGURES:
    (FIG_DIR / "realtime_kernel" / "pharyngeal_endoderm").mkdir(parents=True, exist_ok=True)

FIGURE_FORMAT = "pdf"
SHOW_COLORBAR = not SAVE_FIGURES
(DATA_DIR / "pharyngeal_endoderm" / "results").mkdir(parents=True, exist_ok=True)
Constants#
# fmt: off
S_GENES = [
    "Mcm5", "Pcna", "Tyms", "Fen1", "Mcm2", "Mcm4", "Rrm1", "Ung", "Gins2",
    "Mcm6", "Cdca7", "Dtl", "Prim1", "Uhrf1", "Mlf1ip", "Hells", "Rfc2",
    "Rpa2", "Nasp", "Rad51ap1", "Gmnn", "Wdr76", "Slbp", "Ccne2", "Ubr7",
    "Pold3", "Msh2", "Atad2", "Rad51", "Rrm2", "Cdc45", "Cdc6", "Exo1",
    "Tipin", "Dscc1", "Blm", "Casp8ap2", "Usp1", "Clspn", "Pola1", "Chaf1b",
    "Brip1", "E2f8",
]

G2M_GENES = [
    "Hmgb2", "Cdk1", "Nusap1", "Ube2c", "Birc5", "Tpx2", "Top2a", "Ndc80",
    "Cks2", "Nuf2", "Cks1b", "Mki67", "Tmpo", "Cenpf", "Tacc3", "Fam64a",
    "Smc4", "Ccnb2", "Ckap2l", "Ckap2", "Aurkb", "Bub1", "Kif11", "Anp32e",
    "Tubb4b", "Gtse1", "Kif20b", "Hjurp", "Cdca3", "Hn1", "Cdc20", "Ttk",
    "Cdc25c", "Kif2c", "Rangap1", "Ncapd2", "Dlgap5", "Cdca2", "Cdca8",
    "Ect2", "Kif23", "Hmmr", "Aurka", "Psrc1", "Anln", "Lbr", "Ckap5",
    "Cenpe", "Ctcf", "Nek2", "G2e3", "Gas2l3", "Cbx5", "Cenpa",
]
# fmt: on
Data loading#
adata = sc.read(DATA_DIR / "pharyngeal_endoderm" / "raw" / "adata_pharynx.h5ad")
adata.obsm["X_umap"] = adata.obs[["UMAP1", "UMAP2"]].values
adata.obs["day"] = adata.obs["day_str"].astype(float)
adata.obs = adata.obs[["cluster_name", "day", "is_doublet"]]

adata.obs["cluster_fine"] = (
    pd.read_csv(DATA_DIR / "pharyngeal_endoderm" / "raw" / "cluster_data.csv", index_col=0)
    .loc[adata.obs_names, "res.1"]
    .values
)
adata.obs["cluster_fine"] = adata.obs["cluster_fine"].astype(str).astype("category")

adata = adata[adata.obs["cluster_fine"].isin(["2", "4", "9", "12", "25", "26"]), :].copy()
adata.uns["cluster_name_colors"] = ["#023fa5", "#bec1d4", "#b5bbe3", "#e07b91", "#11c638"]

adata
AnnData object with n_obs × n_vars = 11073 × 27998
    obs: 'cluster_name', 'day', 'is_doublet', 'cluster_fine'
    uns: 'cluster_name_colors'
    obsm: 'X_umap'
mouse_tfs = (
    pd.read_csv(DATA_DIR / "generic" / "mouse_tfs.tsv", sep="\t", header=None)
    .rename(columns={0: "Ensemble ID", 1: "Gene ID"})["Gene ID"]
    .tolist()
)
Data preprocessing#
sc.pp.highly_variable_genes(adata)
extracting highly variable genes
    finished (0:00:03)
sc.tl.pca(adata)
sc.pp.neighbors(adata, n_pcs=30, n_neighbors=30)
computing PCA
    on highly variable genes
    with n_comps=50
    finished (0:00:01)
computing neighbors
    using 'X_pca' with n_pcs = 30
    finished (0:03:01)
sc.tl.umap(adata)
pd.DataFrame(adata.obsm["X_umap"], index=adata.obs_names, columns=["umap_1", "umap_2"]).to_csv(
    DATA_DIR / "pharyngeal_endoderm" / "processed" / "umap_subsetted_data.csv"
)
computing UMAP
    finished (0:00:18)
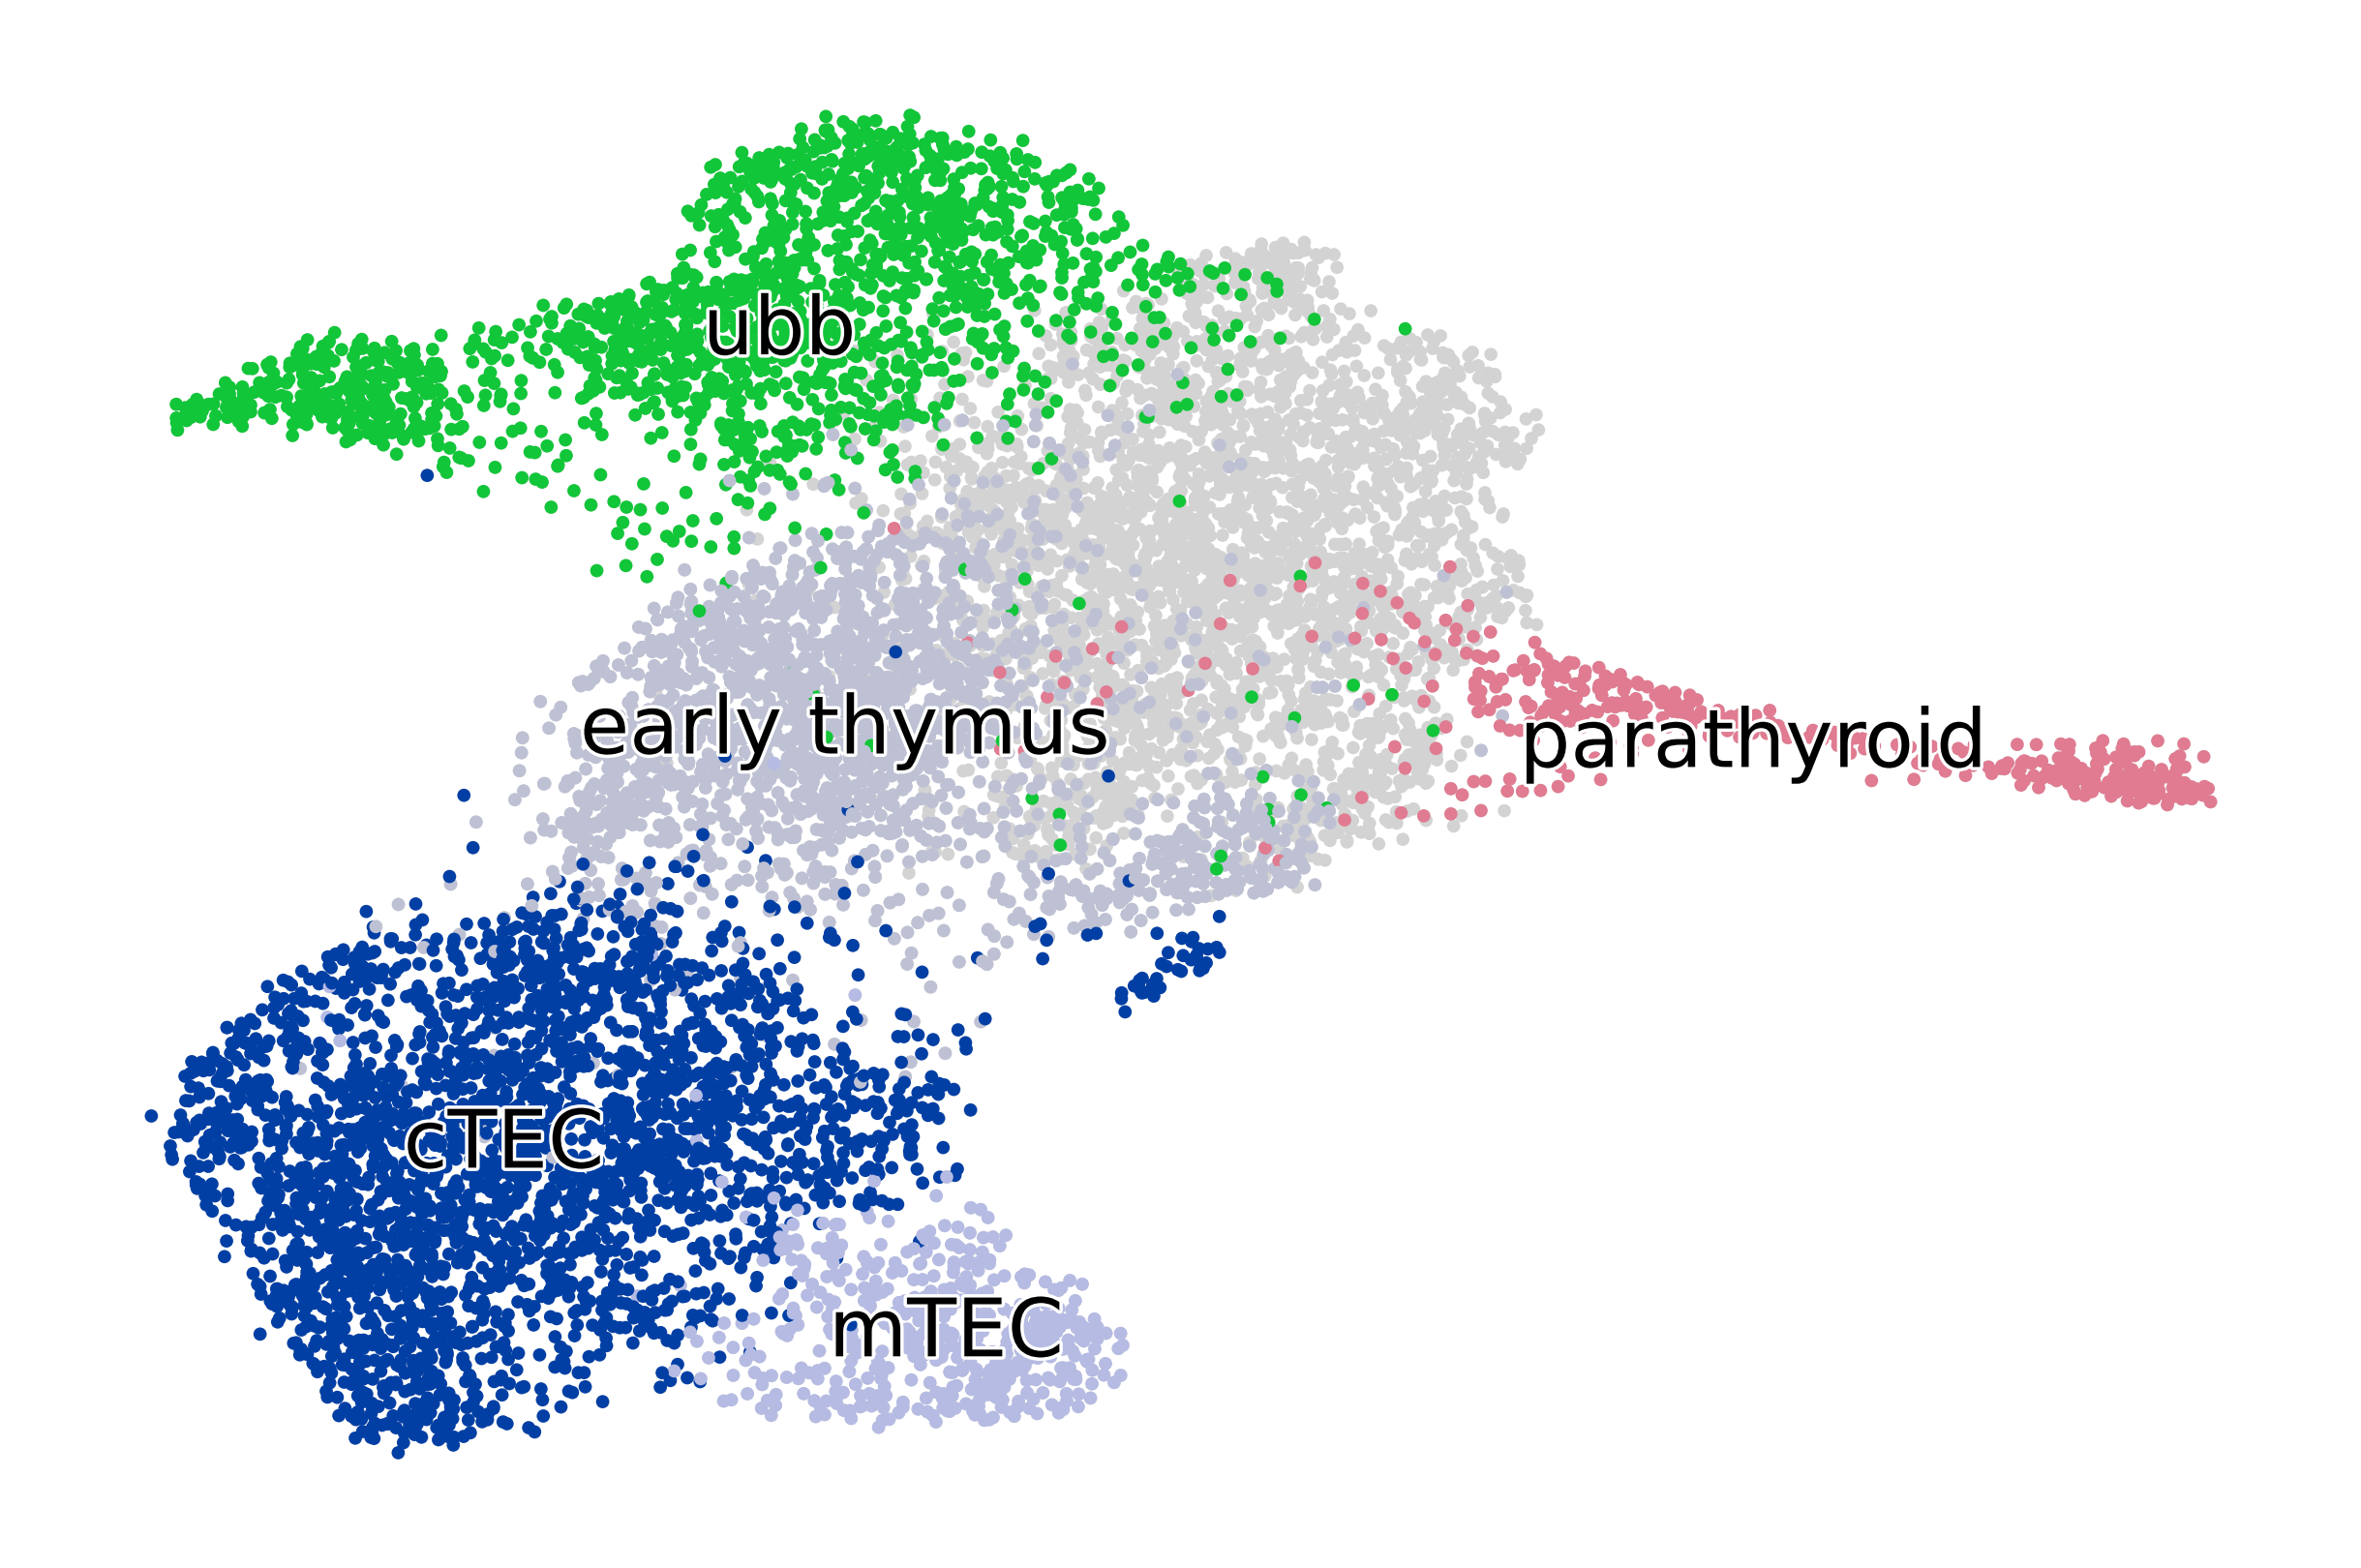
if running_in_notebook():
    scv.pl.scatter(
        adata, basis="umap", c="cluster_name", title="", dpi=250, legend_fontsize=12, legend_fontweight="normal"
    )

if SAVE_FIGURES:
    fig, ax = plt.subplots(figsize=(6, 4))
    scv.pl.scatter(adata, basis="umap", c="cluster_name", legend_loc=False, title="", ax=ax)
    fig.savefig(
        FIG_DIR
        / "realtime_kernel"
        / "pharyngeal_endoderm"
        / f"umap_colored_by_cell_type_subsetted_data.{FIGURE_FORMAT}",
        format=FIGURE_FORMAT,
        transparent=True,
        bbox_inches="tight",
    )

    fig, ax = plt.subplots(figsize=(6, 4))
    scv.pl.scatter(adata, basis="umap", c="day", legend_loc=False, colorbar=SHOW_COLORBAR, title="", ax=ax)
    fig.savefig(
        FIG_DIR / "realtime_kernel" / "pharyngeal_endoderm" / f"umap_colored_by_day_subsetted_data.{FIGURE_FORMAT}",
        format=FIGURE_FORMAT,
        transparent=True,
        bbox_inches="tight",
    )
RealTimeKernel analysis#
if not (DATA_DIR / "pharyngeal_endoderm" / "tmaps_subsetted_data").exists():
    ot_model = wot.ot.OTModel(adata)
    ot_model.compute_all_transport_maps(tmap_out=DATA_DIR / "pharyngeal_endoderm" / "tmaps_subsetted_data" / "tmaps")
adata.obs["day"] = adata.obs["day"].astype("category")

rtk = cr.kernels.RealTimeKernel.from_wot(
    adata, path=DATA_DIR / "pharyngeal_endoderm" / "tmaps_subsetted_data", time_key="day"
)
rtk.compute_transition_matrix(
    growth_iters=3, growth_rate_key="growth_rate_init", self_transitions="all", conn_weight=0.1
)
WARNING: Your filename has more than two extensions: ['.5_11', '.5', '.h5ad'].
Only considering the two last: ['.5', '.h5ad'].
WARNING: Your filename has more than two extensions: ['.5_11', '.5', '.h5ad'].
Only considering the two last: ['.5', '.h5ad'].
WARNING: Your filename has more than two extensions: ['.5_12', '.5', '.h5ad'].
Only considering the two last: ['.5', '.h5ad'].
WARNING: Your filename has more than two extensions: ['.5_12', '.5', '.h5ad'].
Only considering the two last: ['.5', '.h5ad'].
WARNING: Your filename has more than two extensions: ['.5_10', '.5', '.h5ad'].
Only considering the two last: ['.5', '.h5ad'].
WARNING: Your filename has more than two extensions: ['.5_10', '.5', '.h5ad'].
Only considering the two last: ['.5', '.h5ad'].
Using automatic `threshold=0.002242638496682048`
computing neighbors
    using 'X_pca' with n_pcs = 50
    finished (0:00:02)
computing neighbors
    using 'X_pca' with n_pcs = 50
    finished (0:00:01)
computing neighbors
WARNING: n_obs too small: adjusting to `n_neighbors = 4`
    using 'X_pca' with n_pcs = 50
    finished (0:00:00)
computing neighbors
    using 'X_pca' with n_pcs = 50
    finished (0:00:01)
RealTimeKernel[n=11073, growth_iters=3, growth_rate_key='growth_rate_init', threshold='auto', self_transitions='all']
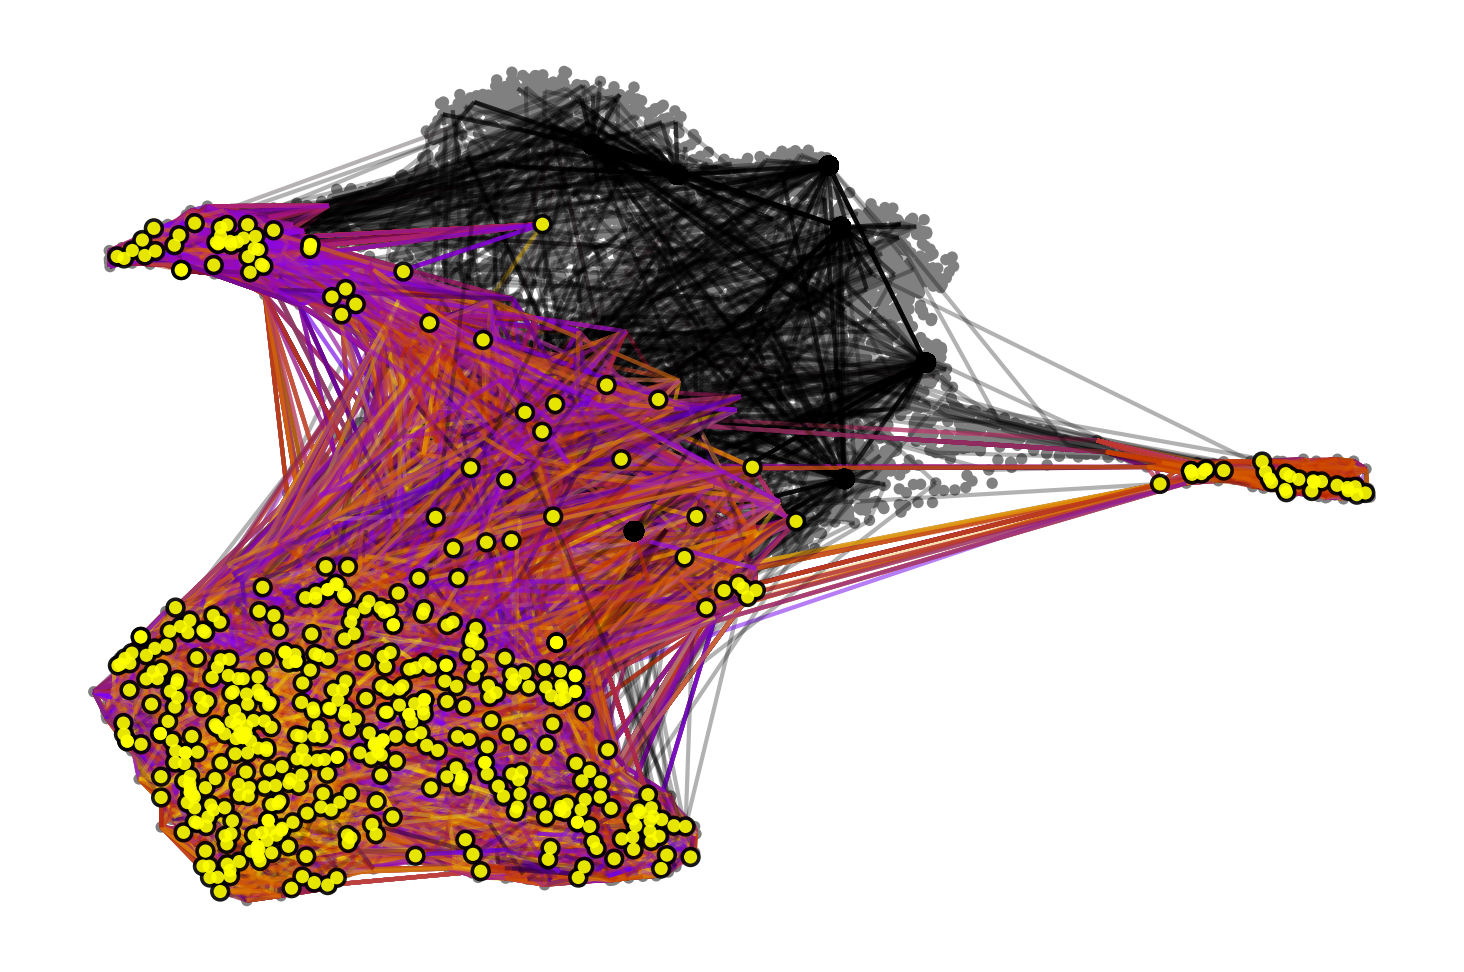
rtk.plot_random_walks(
    n_sims=500,
    max_iter=1000,
    start_ixs={"day": 9.5},
    basis="umap",
    seed=0,
    dpi=150,
    size=30,
    n_jobs=5,
)
Simulating `500` random walks of maximum length `1000`
Global seed set to 0
Global seed set to 0
Global seed set to 0
Global seed set to 0
Global seed set to 0
    Finish (0:00:53)
Plotting random walks
Estimator#
adata.obs["cluster_name_full"] = (
    adata.obs["cluster_name"]
    .astype(str)
    .astype("category")
    .cat.rename_categories({"nan": "progenitors"})
    .cat.reorder_categories(["progenitors"] + adata.obs["cluster_name"].cat.categories.tolist())
)
adata.uns["cluster_name_full_colors"] = ["#dedede"] + adata.uns["cluster_name_colors"]
estimator = cr.estimators.GPCCA(rtk)
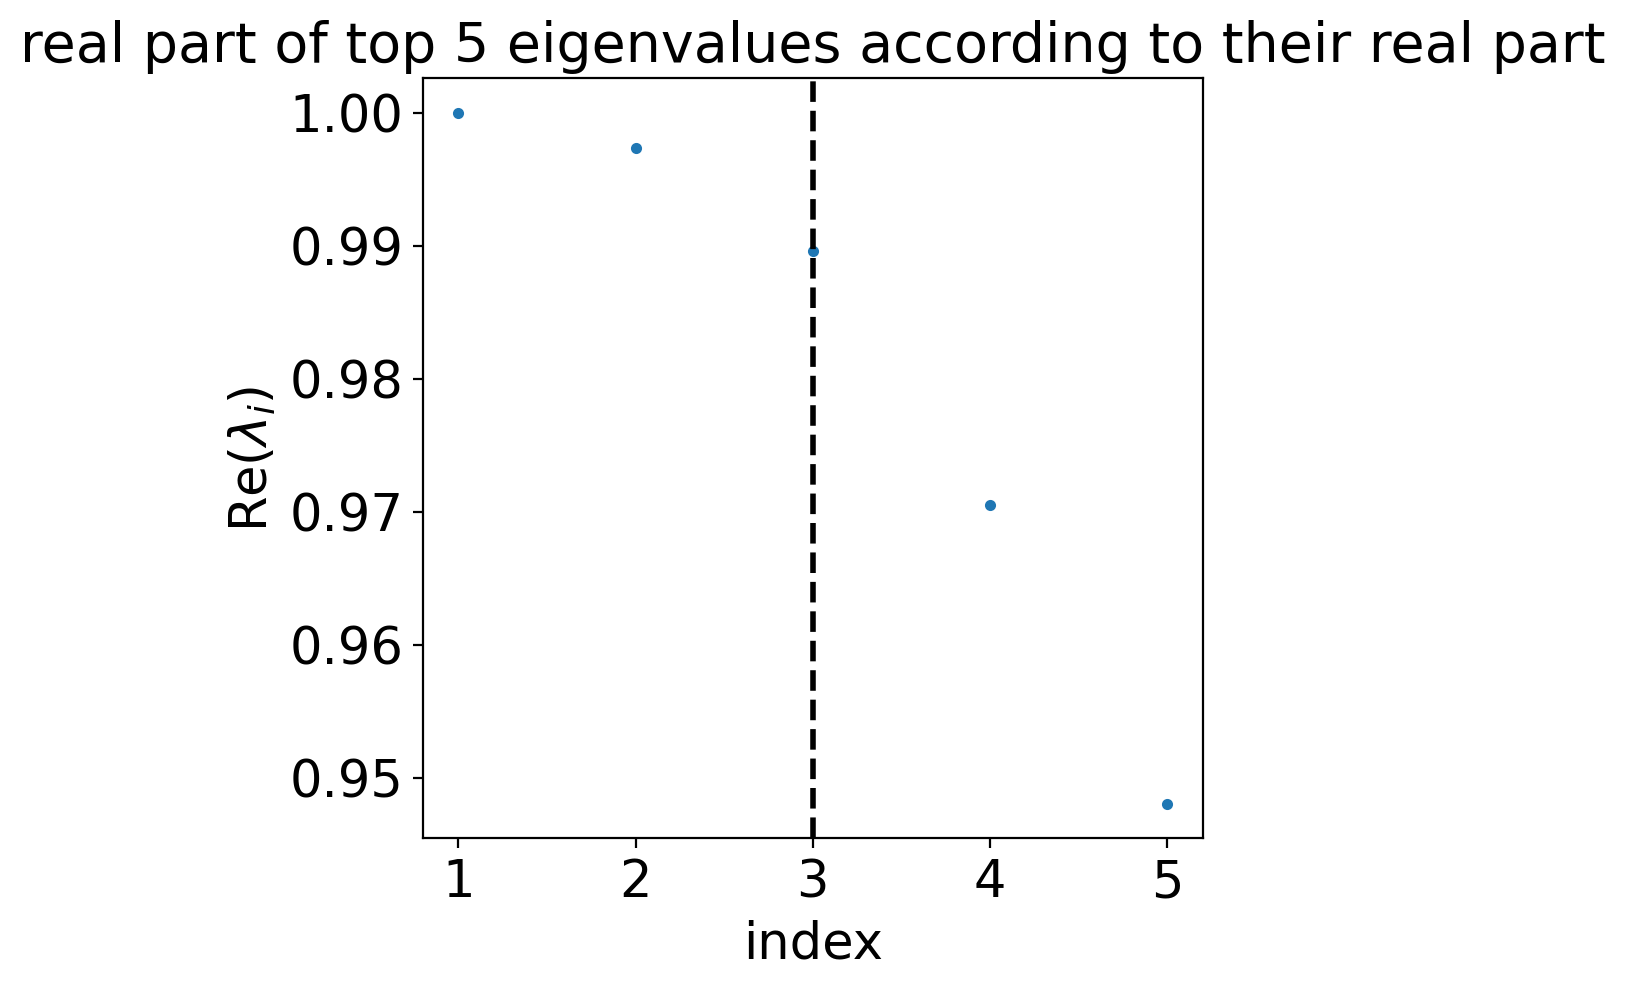
estimator.compute_schur(n_components=5)
estimator.plot_spectrum(real_only=True)
plt.show()
Computing Schur decomposition
Adding `adata.uns['eigendecomposition_fwd']`
       `.schur_vectors`
       `.schur_matrix`
       `.eigendecomposition`
    Finish (0:00:00)
terminal_states = ["parathyroid", "ubb", "cTEC", "mTEC"]
cluster_key = "cluster_name"
if (DATA_DIR / "pharyngeal_endoderm" / "results" / "tsi-subsetted_data-rtk.csv").is_file():
tsi_df = pd.read_csv(DATA_DIR / "pharyngeal_endoderm" / "results" / "tsi-subsetted_data-rtk.csv")
estimator._tsi = AnnData(tsi_df, uns={"terminal_states": terminal_states, "cluster_key": cluster_key})
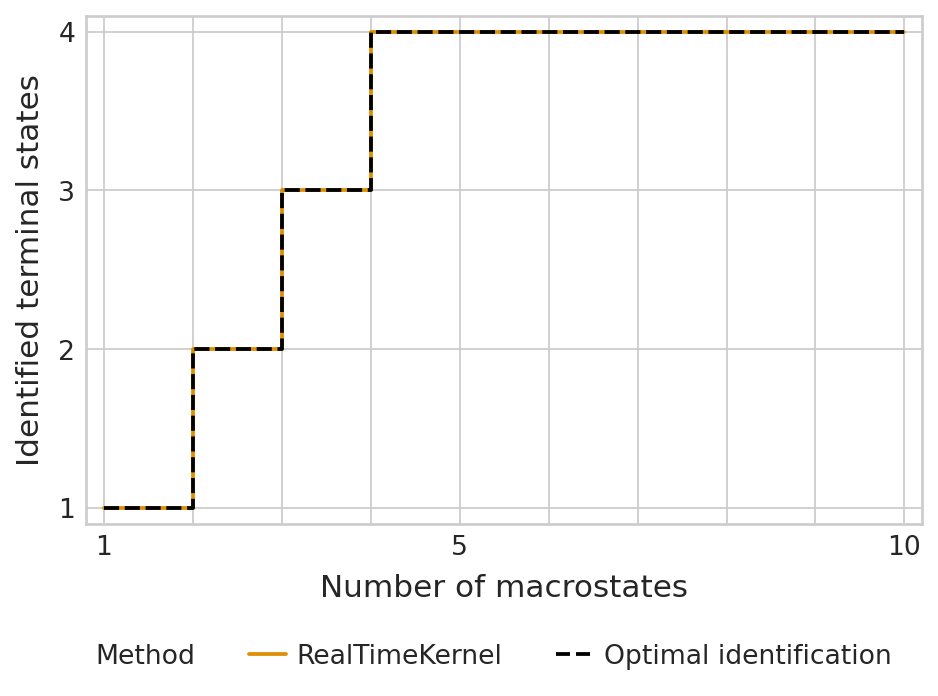
tsi_score = estimator.tsi(n_macrostates=10, terminal_states=terminal_states, cluster_key=cluster_key)
else:
tsi_score = estimator.tsi(n_macrostates=10, terminal_states=terminal_states, cluster_key=cluster_key)
estimator._tsi.to_df().to_csv(
DATA_DIR / "pharyngeal_endoderm" / "results" / "tsi-subsetted_data-rtk.csv", index=False
)
print(f"TSI score: {tsi_score:.2f}")
TSI score: 1.00
/vol/storage/miniconda3/envs/cr2-py38/lib/python3.8/site-packages/anndata/_core/anndata.py:121: ImplicitModificationWarning: Transforming to str index.
  warnings.warn("Transforming to str index.", ImplicitModificationWarning)
palette = {"RealTimeKernel": "#DE8F05", "Optimal identification": "#000000"}

if SAVE_FIGURES:
    fpath = FIG_DIR / "realtime_kernel" / "pharyngeal_endoderm" / f"tsi-subsetted_data-rtk.{FIGURE_FORMAT}"
else:
    fpath = None

with mplscience.style_context():
    sns.set_style(style="whitegrid")
    estimator.plot_tsi(palette=palette, save=fpath)
    plt.show()
estimator.compute_macrostates(n_states=4, cluster_key="cluster_name")
if running_in_notebook():
    estimator.plot_macrostates(which="all", basis="umap", title="", legend_loc="right", size=100)
    if SAVE_FIGURES:
        fpath = (
            FIG_DIR
            / "realtime_kernel"
            / "pharyngeal_endoderm"
            / f"umap_colored_by_macrostates_subsetted_data.{FIGURE_FORMAT}"
        )
        estimator.plot_macrostates(which="all", basis="umap", title="", legend_loc=False, size=100, save=fpath)
Computing `4` macrostates
DEBUG: Setting the macrostates using macrostates memberships
DEBUG: Raising an exception if there are less than `6` cells.
Adding `.macrostates`
       `.macrostates_memberships`
       `.coarse_T`
       `.coarse_initial_distribution
       `.coarse_stationary_distribution`
       `.schur_vectors`
       `.schur_matrix`
       `.eigendecomposition`
    Finish (0:00:01)
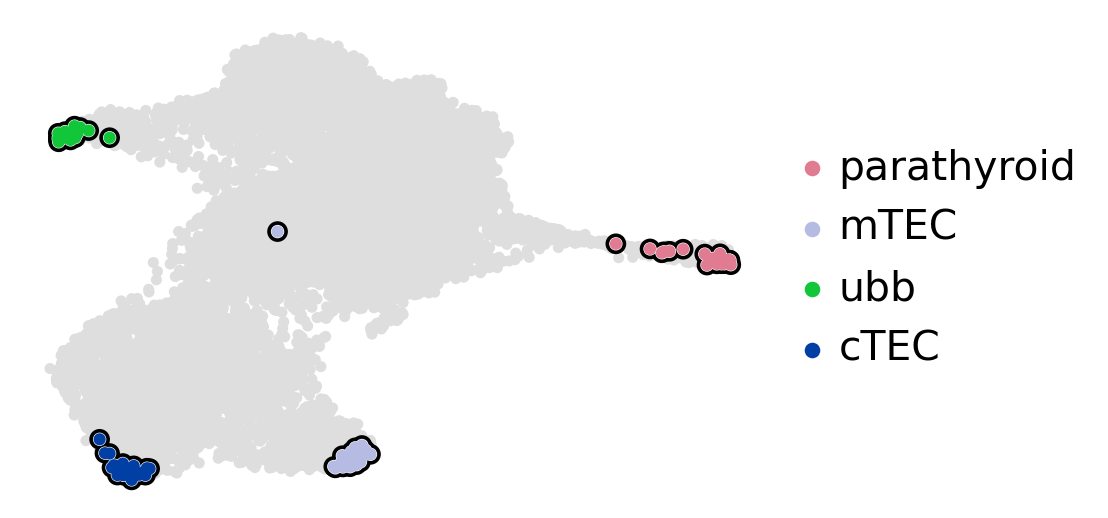
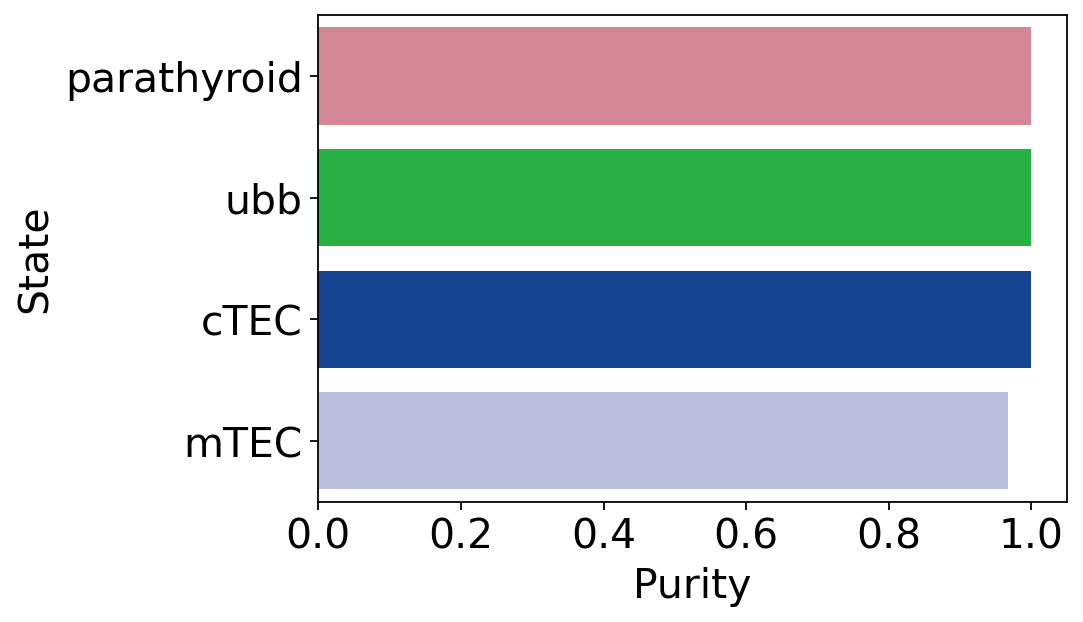
macrostate_purity = get_state_purity(adata, estimator, states="macrostates", obs_col="cluster_name")
print(f"Mean purity: {np.mean(list(macrostate_purity.values()))}")

if running_in_notebook():
    if SAVE_FIGURES:
        fpath = (
            FIG_DIR / "realtime_kernel" / "pharyngeal_endoderm" / f"macrostate_purity_subsetted_data.{FIGURE_FORMAT}"
        )
    else:
        fpath = None

    palette = dict(zip(estimator.macrostates.cat.categories, estimator._macrostates.colors))

    plot_state_purity(macrostate_purity, palette=palette, fpath=fpath, format=FIGURE_FORMAT)
    plt.show()
Mean purity: 0.9916666666666667
estimator.set_terminal_states(["parathyroid", "cTEC", "mTEC", "ubb"])

if running_in_notebook():
    estimator.plot_macrostates(which="terminal", basis="umap", title="", legend_loc="right", size=100)
    if SAVE_FIGURES:
        fpath = (
            FIG_DIR
            / "realtime_kernel"
            / "pharyngeal_endoderm"
            / f"umap_colored_by_terminal_states_subsetted_data.{FIGURE_FORMAT}"
        )
        estimator.plot_macrostates(which="terminal", basis="umap", title="", legend_loc=False, size=100, save=fpath)
DEBUG: Raising an exception if there are less than `6` cells.
Adding `adata.obs['term_states_fwd']`
       `adata.obs['term_states_fwd_probs']`
       `.terminal_states`
       `.terminal_states_probabilities`
       `.terminal_states_memberships
    Finish`
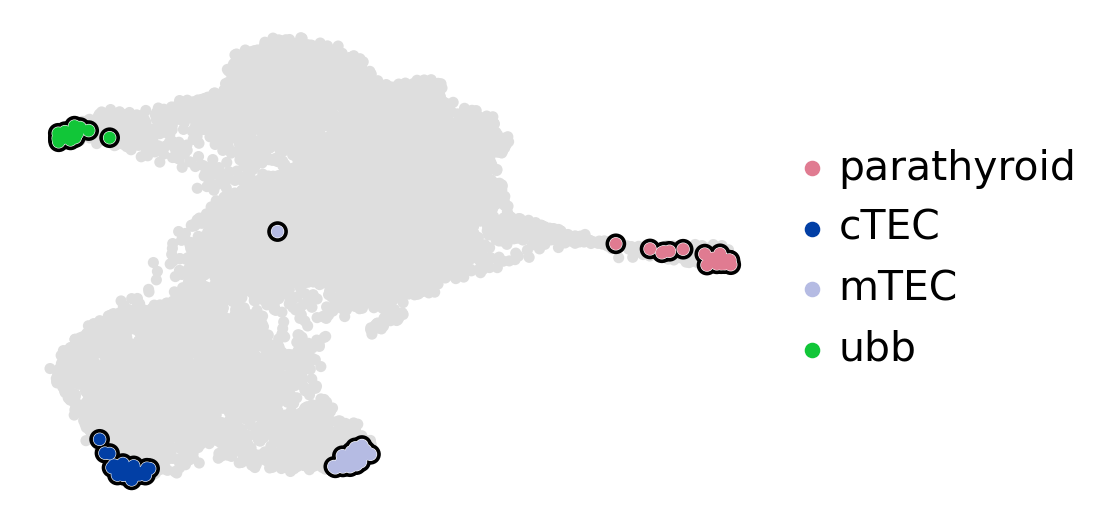
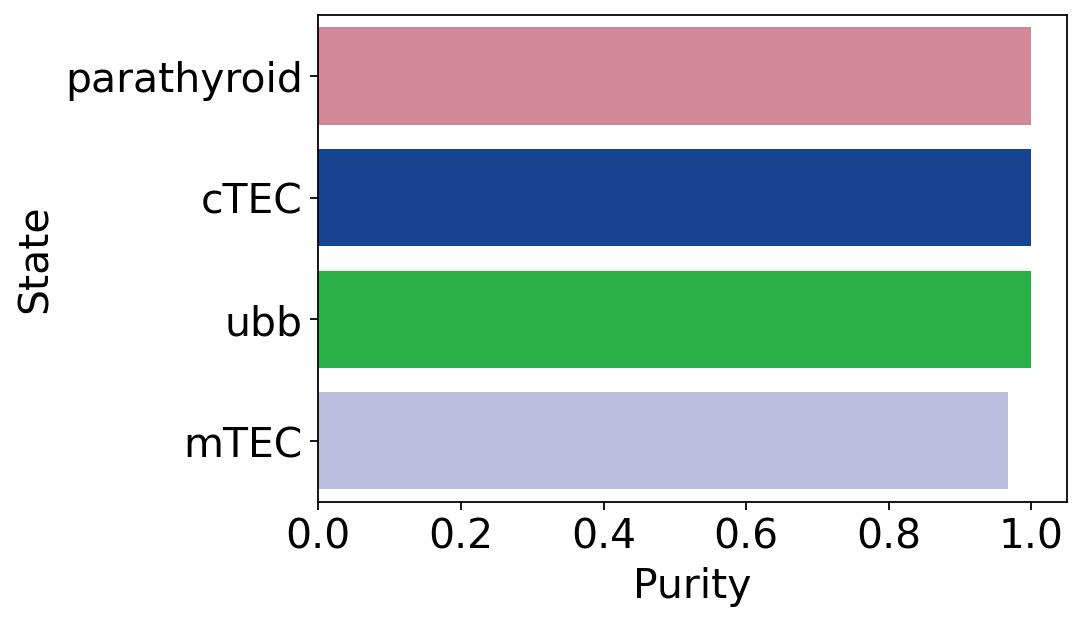
macrostate_purity = get_state_purity(adata, estimator, states="terminal_states", obs_col="cluster_name")
print(f"Mean purity: {np.mean(list(macrostate_purity.values()))}")

if running_in_notebook():
    if SAVE_FIGURES:
        fpath = (
            FIG_DIR
            / "realtime_kernel"
            / "pharyngeal_endoderm"
            / f"terminal_states_purity_subsetted_data.{FIGURE_FORMAT}"
        )
    else:
        fpath = None

    palette = dict(zip(estimator.terminal_states.cat.categories, estimator._term_states.colors))

    plot_state_purity(macrostate_purity, palette=palette, fpath=fpath, format=FIGURE_FORMAT)
    plt.show()
Mean purity: 0.9916666666666667
estimator.compute_fate_probabilities(solver="gmres", use_petsc=True)
Computing fate probabilities
DEBUG: Solving the linear system using `PETSc` solver `'gmres'` on `1` core(s) with no preconditioner and `tol=1e-06`
Adding `adata.obsm['lineages_fwd']`
       `.fate_probabilities`
    Finish (0:00:00)
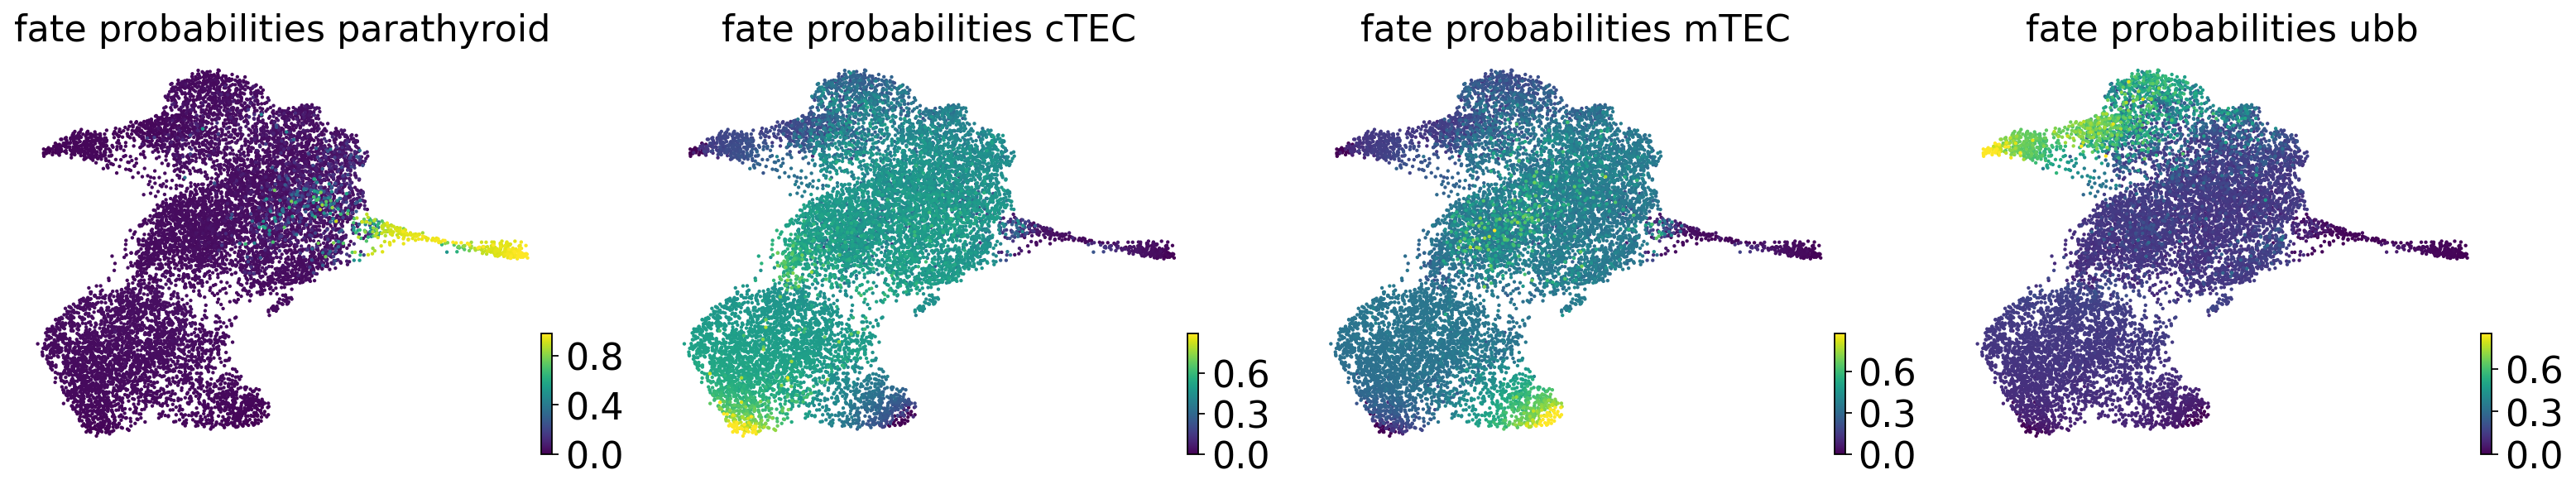
estimator.compute_fate_probabilities()
if running_in_notebook():
    estimator.plot_fate_probabilities(same_plot=False, basis="umap", ncols=4)

if SAVE_FIGURES:
    for terminal_state in estimator.terminal_states.cat.categories:
        adata.obs[f"fate_prob_{terminal_state}"] = adata.obsm["lineages_fwd"][:, terminal_state].X.squeeze()
        fig, ax = plt.subplots(figsize=(6, 4))

        if running_in_notebook():
            scv.pl.scatter(
                adata,
                basis="umap",
                color=f"fate_prob_{terminal_state}",
                cmap="viridis",
                title="",
                colorbar=SHOW_COLORBAR,
                ax=ax,
            )

            fig.savefig(
                FIG_DIR
                / "realtime_kernel"
                / "pharyngeal_endoderm"
                / f"fate_prob_{terminal_state}_subsetted_data.{FIGURE_FORMAT}",
                format=FIGURE_FORMAT,
                transparent=True,
                bbox_inches="tight",
            )
Computing fate probabilities
DEBUG: Solving the linear system using `PETSc` solver `'gmres'` on `1` core(s) with no preconditioner and `tol=1e-06`
Adding `adata.obsm['lineages_fwd']`
       `.fate_probabilities`
    Finish (0:00:00)
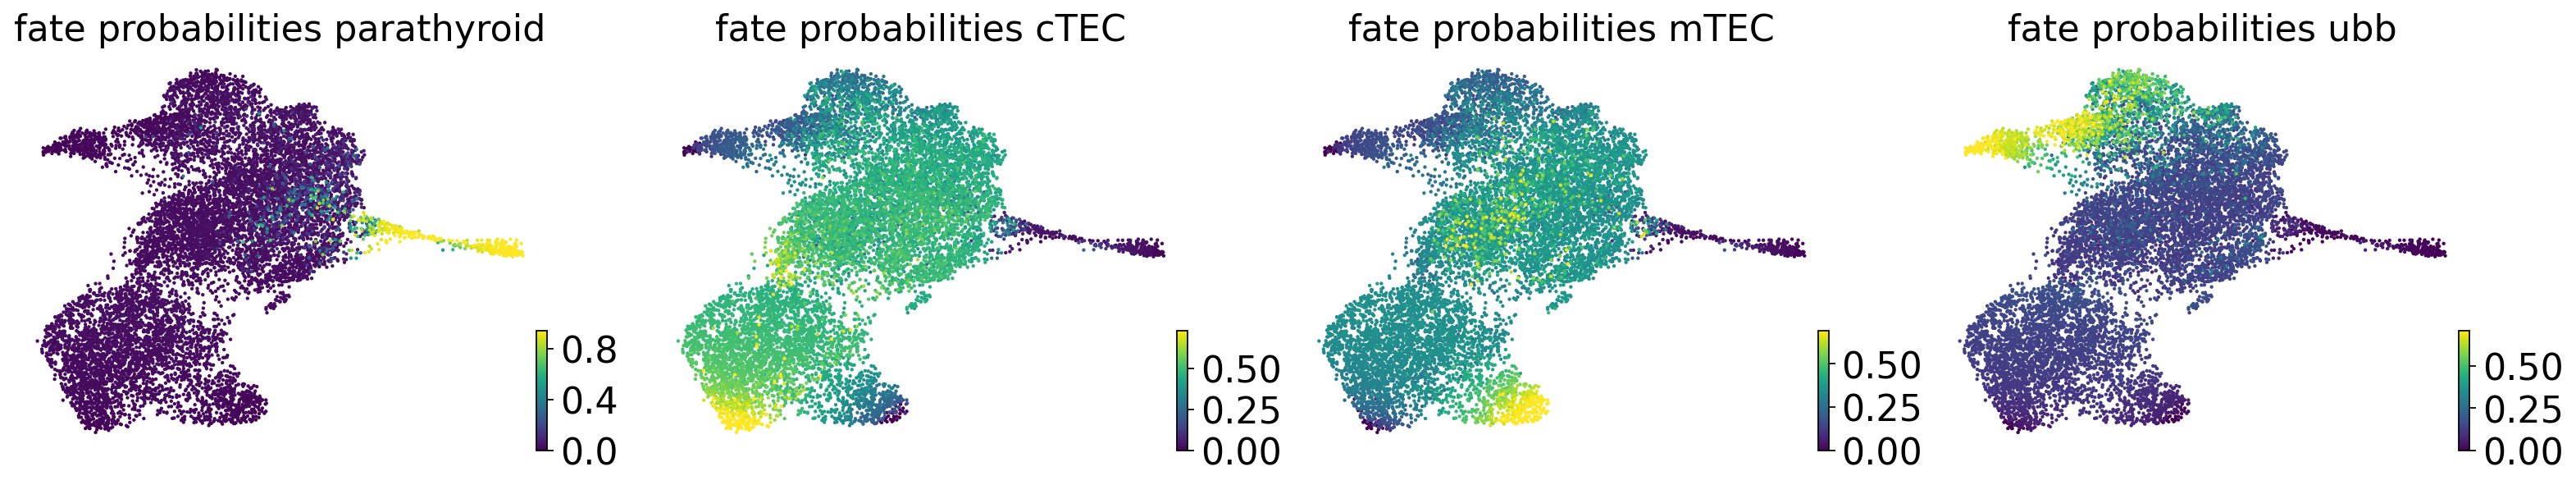
estimator.compute_fate_probabilities()
if running_in_notebook():
    estimator.plot_fate_probabilities(same_plot=False, basis="umap", perc=[0, 99], ncols=4)

if SAVE_FIGURES:
    for terminal_state in estimator.terminal_states.cat.categories:
        adata.obs[f"fate_prob_{terminal_state}"] = adata.obsm["lineages_fwd"][:, terminal_state].X.squeeze()
        fig, ax = plt.subplots(figsize=(6, 4))

        if running_in_notebook():
            scv.pl.scatter(
                adata,
                basis="umap",
                color=f"fate_prob_{terminal_state}",
                cmap="viridis",
                title="",
                colorbar=SHOW_COLORBAR,
                perc=[0, 99],
                ax=ax,
            )

            fig.savefig(
                FIG_DIR
                / "realtime_kernel"
                / "pharyngeal_endoderm"
                / f"fate_prob_{terminal_state}_clipped_subsetted_data.{FIGURE_FORMAT}",
                format=FIGURE_FORMAT,
                transparent=True,
                bbox_inches="tight",
            )
Computing fate probabilities
DEBUG: Solving the linear system using `PETSc` solver `'gmres'` on `1` core(s) with no preconditioner and `tol=1e-06`
Adding `adata.obsm['lineages_fwd']`
       `.fate_probabilities`
    Finish (0:00:00)
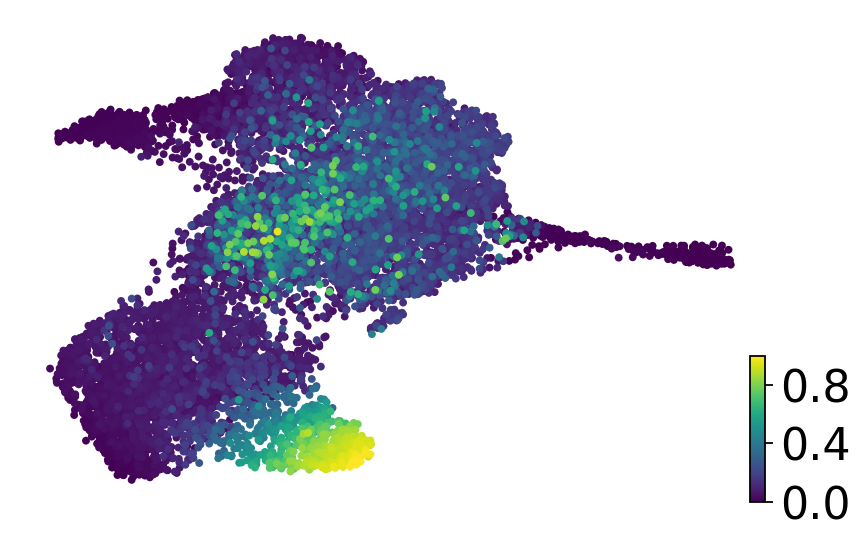
adata.obs["mTEC_abs_probs"] = adata.obsm["term_states_fwd_memberships"]["mTEC"].X.squeeze()
if running_in_notebook():
fig, ax = plt.subplots(figsize=(6, 4))
scv.pl.scatter(
adata,
basis="umap",
c="mTEC_abs_probs",
s=50,
cmap="viridis",
title="",
legend_loc=None,
colorbar=SHOW_COLORBAR,
ax=ax,
)
if SAVE_FIGURES:
fig.savefig(
FIG_DIR / "realtime_kernel" / "pharyngeal_endoderm" / f"mtec_fate_probs_subsetted_data.{FIGURE_FORMAT}",
format=FIGURE_FORMAT,
transparent=True,
bbox_inches="tight",
)
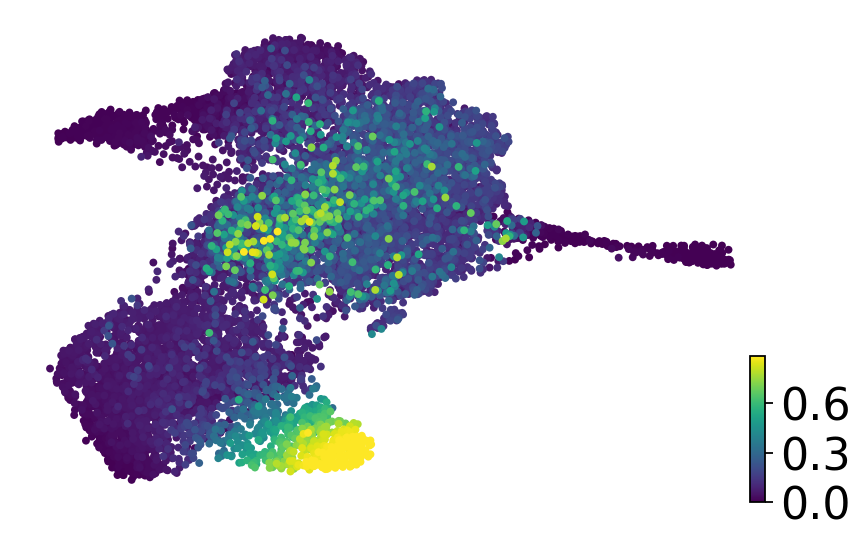
mTEC_abs_probs = adata.obsm["term_states_fwd_memberships"]["mTEC"].X.squeeze()
percentile = np.percentile(mTEC_abs_probs, 99)
mTEC_abs_probs = np.clip(mTEC_abs_probs, a_min=mTEC_abs_probs.min(), a_max=percentile)
adata.obs["mTEC_abs_probs"] = mTEC_abs_probs
if running_in_notebook():
fig, ax = plt.subplots(figsize=(6, 4))
scv.pl.scatter(
adata,
basis="umap",
c="mTEC_abs_probs",
s=50,
cmap="viridis",
title="",
legend_loc=None,
colorbar=SHOW_COLORBAR,
ax=ax,
)
if SAVE_FIGURES:
fig.savefig(
FIG_DIR
/ "realtime_kernel"
/ "pharyngeal_endoderm"
/ f"mtec_fate_probs_clipped_subsetted_data.{FIGURE_FORMAT}",
format=FIGURE_FORMAT,
transparent=True,
bbox_inches="tight",
)
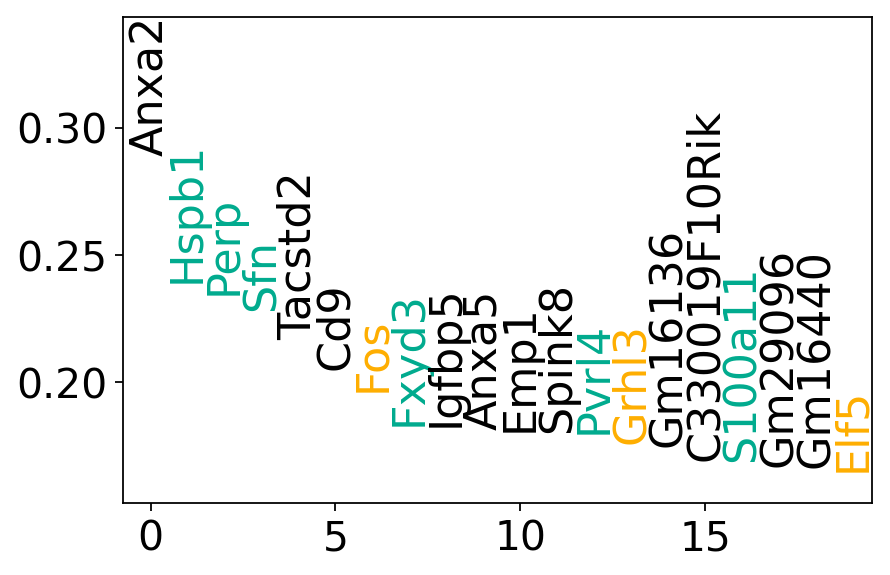
Driver analysis#
# fmt: off
mtec_genes = [
    "Cldn3", "Cldn4", "Notch1", "Krt5", "H2-Aa", "H2-Ab1", "H2-Eb1",
    "Grhl3", "Grhl1", "Elf5", "Irf6", "Sox9", "Upk2", "Ovol1", "Hes1",
    "Rhov", "Pvrl4", "Klf5", "Egr1", "Sfn", "Perp", "Fxyd3", "Hspb1",
    "Krt5", "S100a11",
]
# fmt: on
drivers_mtec = estimator.compute_lineage_drivers(
    return_drivers=True, cluster_key="cluster_fine", lineages=["mTEC"], clusters=["2", "9"]
)
DEBUG: Computing correlations for lineages `['mTEC']` restricted to clusters `['2', '9']` in layer `X` with `use_raw=False`
Adding `adata.varm['terminal_lineage_drivers']`
       `.lineage_drivers`
    Finish (0:00:02)
gene_names = drivers_mtec.loc[
    ~(
        drivers_mtec.index.str.startswith(("mt.", "Rpl", "Rps", "^Hb[^(p)]"))
        | drivers_mtec.index.isin(S_GENES + G2M_GENES)
    ),
    :,
].index
cr_ranking = pd.DataFrame(
    drivers_mtec.loc[gene_names, "mTEC_corr"],
)
cr_ranking["ranking"] = np.arange(len(gene_names))
cr_ranking.to_csv(DATA_DIR / "pharyngeal_endoderm" / "results" / "driver_genes_ranking_cr.csv")
df = cr_ranking.iloc[:20, :]

if running_in_notebook():
    fig, ax = plt.subplots(figsize=(6, 4))
    y_min = np.min(df["mTEC_corr"])
    y_max = np.max(df["mTEC_corr"])

    y_min -= 0.1 * (y_max - y_min)
    y_max += 0.4 * (y_max - y_min)
    ax.set_ylim(y_min, y_max)

    ax.set_xlim(-0.75, 19.5)

    for gene in df.index:
        if gene in mouse_tfs:
            color = "#FEAE00"
        elif gene in mtec_genes:
            color = "#00AB8E"
        else:
            color = "#000000"
        ax.text(
            df.loc[gene, "ranking"],
            df.loc[gene, "mTEC_corr"],
            gene,
            rotation="vertical",
            verticalalignment="bottom",
            horizontalalignment="center",
            fontsize=20,
            color=color,
        )

    if SAVE_FIGURES:
        fig.savefig(
            FIG_DIR / "realtime_kernel" / "pharyngeal_endoderm" / f"genes_ranked_by_correlation.{FIGURE_FORMAT}",
            format=FIGURE_FORMAT,
            transparent=True,
            bbox_inches="tight",
        )
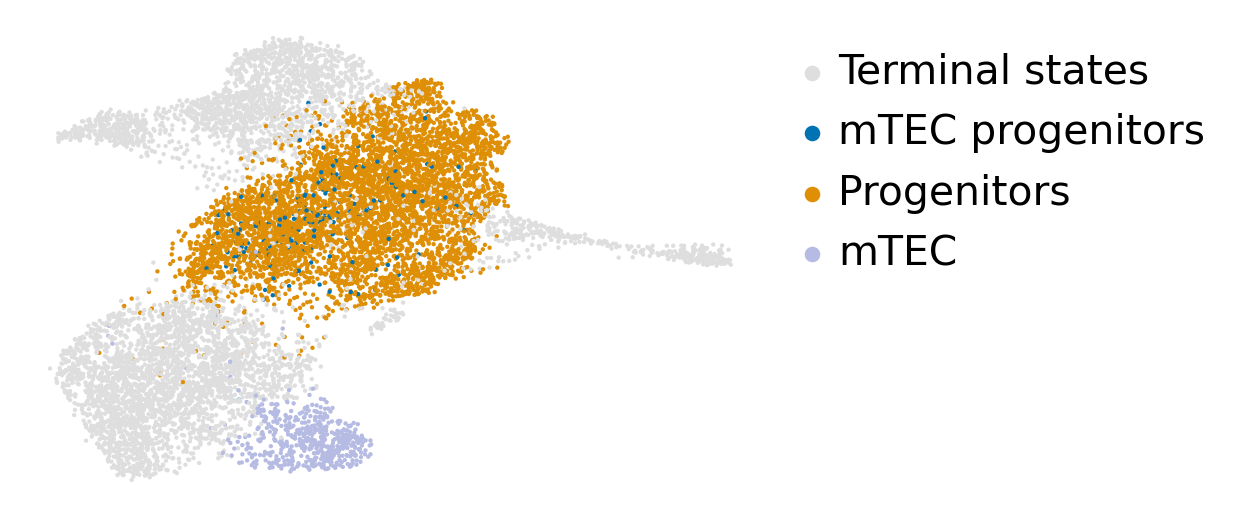
Classical DE testing#
fate_prob_threshold = 0.5
adata.obs["mTEC_progenitors"] = False
adata.obs.loc[
adata.obs["cluster_fine"].isin(["2", "9"]) & (adata.obs["mTEC_abs_probs"] > fate_prob_threshold), "mTEC_progenitors"
] = True
adata.obs["mTEC_progenitors_groups"] = "Terminal states"
adata.obs.loc[adata.obs["cluster_name"].isin(["mTEC"]), "mTEC_progenitors_groups"] = "mTEC"
adata.obs.loc[
adata.obs["cluster_fine"].isin(["2", "9"]) & (adata.obs["mTEC_abs_probs"] <= fate_prob_threshold),
"mTEC_progenitors_groups",
] = "Progenitors"
adata.obs.loc[
adata.obs["cluster_fine"].isin(["2", "9"]) & (adata.obs["mTEC_abs_probs"] > fate_prob_threshold),
"mTEC_progenitors_groups",
] = "mTEC progenitors"
adata.obs["mTEC_progenitors_groups"] = (
adata.obs["mTEC_progenitors_groups"]
.astype("category")
.cat.reorder_categories(["Terminal states", "mTEC progenitors", "Progenitors", "mTEC"])
)
adata.uns["mTEC_progenitors_groups_colors"] = ["#dedede", "#0173b2", "#de8f05", "#b5bbe3"]
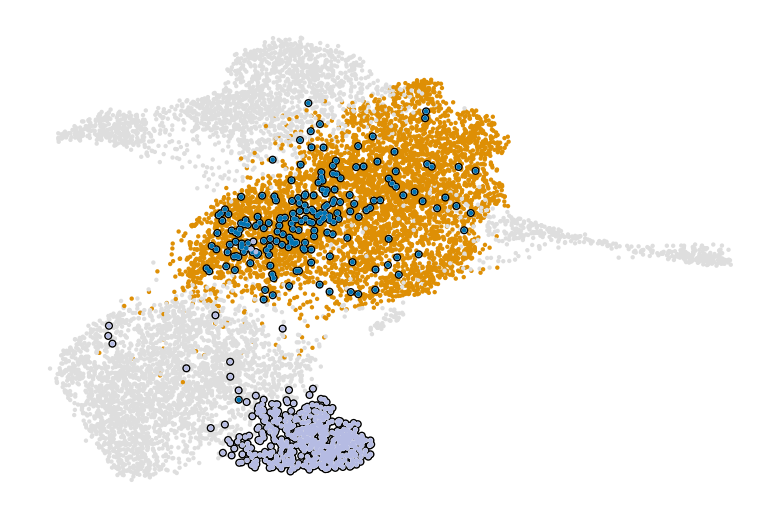
if running_in_notebook():
fig, ax = plt.subplots(figsize=(6, 4))
scv.pl.scatter(adata, basis="umap", c="mTEC_progenitors_groups", title="", ax=ax)
fig, ax = plt.subplots(figsize=(6, 4))
scv.pl.scatter(
adata,
basis="umap",
c="mTEC_progenitors_groups",
add_outline=["mTEC progenitors", "mTEC"],
title="",
legend_loc=False,
ax=ax,
)
if SAVE_FIGURES:
fig, ax = plt.subplots(figsize=(6, 4))
scv.pl.scatter(
adata,
basis="umap",
c="mTEC_progenitors_groups",
add_outline=["mTEC progenitors", "mTEC"],
title="",
legend_loc=False,
ax=ax,
)
fig.savefig(
FIG_DIR
/ "realtime_kernel"
/ "pharyngeal_endoderm"
/ f"umap_mtec_progenitors_subsetted_data.{FIGURE_FORMAT}",
format=FIGURE_FORMAT,
transparent=True,
bbox_inches="tight",
dpi=400,
)
adata_progenitors = adata[
    adata.obs["mTEC_progenitors_groups"].isin(["Progenitors", "mTEC progenitors"]),
    ~(adata.var_names.str.startswith(("mt.", "Rpl", "Rps", "^Hb[^(p)]")) | adata.var_names.isin(S_GENES + G2M_GENES)),
].copy()

sc.tl.rank_genes_groups(
    adata_progenitors, groupby="mTEC_progenitors_groups", groups=["Progenitors", "mTEC progenitors"]
)
WARNING: Default of the method has been changed to 't-test' from 't-test_overestim_var'
ranking genes
    finished (0:00:01)
gene_names = (
    pd.DataFrame(adata_progenitors.uns["rank_genes_groups"]["names"]).set_index("mTEC progenitors").index.tolist()
)
de_scores = (
    pd.DataFrame(adata_progenitors.uns["rank_genes_groups"]["scores"]).set_index("mTEC progenitors").index.tolist()
)
de_ranking = pd.DataFrame({"ranking": np.arange(len(de_scores)), "DE score": de_scores}, index=gene_names)
de_ranking.to_csv(DATA_DIR / "pharyngeal_endoderm" / "results" / "driver_genes_ranking_de.csv")
gene_names = (
    pd.DataFrame(adata_progenitors.uns["rank_genes_groups"]["names"]).set_index("mTEC progenitors").index.tolist()
)
de_scores = (
    pd.DataFrame(adata_progenitors.uns["rank_genes_groups"]["scores"]).set_index("mTEC progenitors").index.tolist()
)
df = de_ranking.iloc[:20, :]

if running_in_notebook():
    fig, ax = plt.subplots(figsize=(6, 4))
    y_min = np.min(df["DE score"])
    y_max = np.max(df["DE score"])

    y_min -= 0.1 * (y_max - y_min)
    y_max += 0.4 * (y_max - y_min)
    ax.set_ylim(y_min, y_max)

    ax.set_xlim(-0.75, 19.5)

    for gene in df.index:
        if gene in mouse_tfs:
            color = "#FEAE00"
        elif gene in mtec_genes:
            color = "#00AB8E"
        else:
            color = "#000000"
        ax.text(
            df.loc[gene, "ranking"],
            df.loc[gene, "DE score"],
            gene,
            rotation="vertical",
            verticalalignment="bottom",
            horizontalalignment="center",
            fontsize=20,
            color=color,
        )

    if SAVE_FIGURES:
        fig.savefig(
            FIG_DIR / "realtime_kernel" / "pharyngeal_endoderm" / f"genes_ranked_by_de.{FIGURE_FORMAT}",
            format=FIGURE_FORMAT,
            transparent=True,
            bbox_inches="tight",
        )
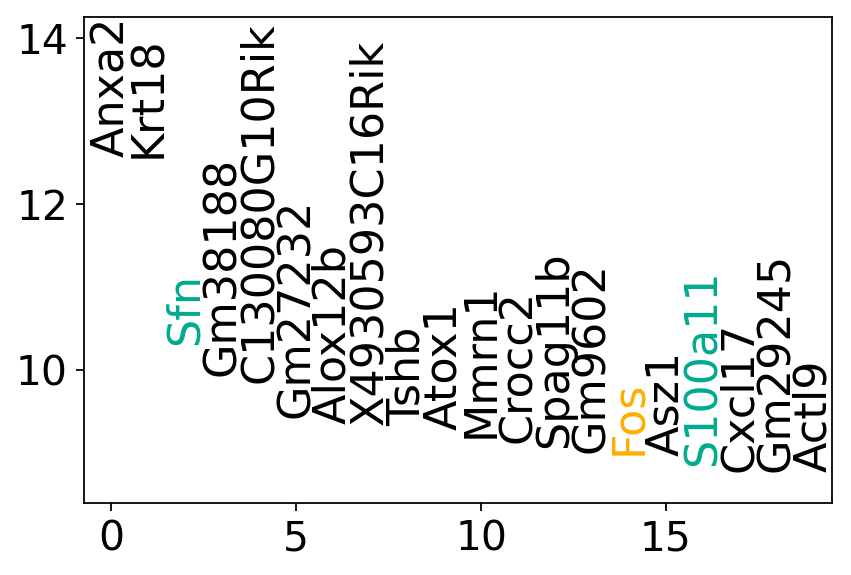
_mtec_genes = list(set(mtec_genes).intersection(cr_ranking.index))

_perc = (cr_ranking.loc[_mtec_genes, "ranking"] <= de_ranking.loc[_mtec_genes, "ranking"]).mean() * 100
print(f"Percentage of genes that CR ranks higher or equal than classical DE: {_perc:.2f}%")

_perc = (cr_ranking.loc[_mtec_genes, "ranking"] < de_ranking.loc[_mtec_genes, "ranking"]).mean() * 100
print(f"Percentage of genes that CR ranks strictly higher than classical DE: {_perc:.2f}%")
Percentage of genes that CR ranks higher or equal than classical DE: 71.43%
Percentage of genes that CR ranks strictly higher than classical DE: 66.67%