E2f1 perturbation on pancreatic endocrine dataset#
Notebook for analyzing cell cycling population in pancreatic endocrine
Library imports#
import numpy as np
import pandas as pd
from scipy.stats import fisher_exact, pearsonr

import matplotlib.pyplot as plt
import mplscience
import seaborn as sns

import scanpy as sc
import scvelo as scv
from regvelo import REGVELOVI

from rgv_tools import DATA_DIR, FIG_DIR
from rgv_tools.benchmarking import set_output
from rgv_tools.perturbation import in_silico_block_simulation
from rgv_tools.utils import cosine_dist, min_max_scaling
/home/icb/weixu.wang/miniconda3/envs/regvelo_test/lib/python3.10/site-packages/anndata/utils.py:429: FutureWarning: Importing read_csv from `anndata` is deprecated. Import anndata.io.read_csv instead.
  warnings.warn(msg, FutureWarning)
/home/icb/weixu.wang/miniconda3/envs/regvelo_test/lib/python3.10/site-packages/anndata/utils.py:429: FutureWarning: Importing read_excel from `anndata` is deprecated. Import anndata.io.read_excel instead.
  warnings.warn(msg, FutureWarning)
/home/icb/weixu.wang/miniconda3/envs/regvelo_test/lib/python3.10/site-packages/anndata/utils.py:429: FutureWarning: Importing read_hdf from `anndata` is deprecated. Import anndata.io.read_hdf instead.
  warnings.warn(msg, FutureWarning)
/home/icb/weixu.wang/miniconda3/envs/regvelo_test/lib/python3.10/site-packages/anndata/utils.py:429: FutureWarning: Importing read_loom from `anndata` is deprecated. Import anndata.io.read_loom instead.
  warnings.warn(msg, FutureWarning)
/home/icb/weixu.wang/miniconda3/envs/regvelo_test/lib/python3.10/site-packages/anndata/utils.py:429: FutureWarning: Importing read_mtx from `anndata` is deprecated. Import anndata.io.read_mtx instead.
  warnings.warn(msg, FutureWarning)
/home/icb/weixu.wang/miniconda3/envs/regvelo_test/lib/python3.10/site-packages/anndata/utils.py:429: FutureWarning: Importing read_text from `anndata` is deprecated. Import anndata.io.read_text instead.
  warnings.warn(msg, FutureWarning)
/home/icb/weixu.wang/miniconda3/envs/regvelo_test/lib/python3.10/site-packages/anndata/utils.py:429: FutureWarning: Importing read_umi_tools from `anndata` is deprecated. Import anndata.io.read_umi_tools instead.
  warnings.warn(msg, FutureWarning)
Matplotlib is building the font cache; this may take a moment.
General settings#
%matplotlib inline
plt.rcParams["svg.fonttype"] = "none"
sns.reset_defaults()
sns.reset_orig()
scv.settings.set_figure_params("scvelo", dpi_save=400, dpi=80, transparent=True, fontsize=14, color_map="viridis")
Constants#
DATASET = "pancreatic_endocrinogenesis"
SAVE_DATA = True
if SAVE_DATA:
    (DATA_DIR / DATASET / "results").mkdir(parents=True, exist_ok=True)

SAVE_FIGURES = True
if SAVE_FIGURES:
    (FIG_DIR / DATASET).mkdir(parents=True, exist_ok=True)
TERMINAL_STATES = ["Beta", "Alpha", "Delta", "Epsilon"]
PALETTE = {"Gene expression": "#555555", "KL divergence": "#ffc0cb"}
MODEL = DATA_DIR / DATASET / "processed" / "rgv_model"
Data loading#
adata = sc.read_h5ad(DATA_DIR / DATASET / "processed" / "adata_preprocessed.h5ad")
TF = adata.var_names[adata.var["tf"]]
Calculate cell cycling score#
scv.tl.score_genes_cell_cycle(adata)
calculating cell cycle phase
-->     'S_score' and 'G2M_score', scores of cell cycle phases (adata.obs)
Excluded G1 phase and focus on the regulator during G2M to S phase transition
adata_raw = adata.copy()
bdata = adata[adata.obs["phase"] != "G1"].copy()
Ranking the TFs according to their correlation with cell state transition
score = min_max_scaling(bdata.obs["S_score"]) - min_max_scaling(bdata.obs["G2M_score"])
gene_ranking = []
for i in range(bdata.shape[1]):
    gene_ranking.append(pearsonr(bdata.X.A[:, i], score)[0])
rank_df = pd.DataFrame({"Ranking": gene_ranking})
rank_df.index = bdata.var_names.tolist()
TF = bdata.var_names[bdata.var["tf"]]
rank_df.loc[TF, :].sort_values(by="Ranking", ascending=False)
| Ranking | |
|---|---|
| index | |
| E2f1 | 0.294368 |
| Sox5 | 0.074033 |
| Klf10 | 0.065834 |
| Rest | 0.055055 |
| Tcf7l2 | 0.043340 |
| ... | ... |
| Atoh8 | -0.079180 |
| Foxn3 | -0.097777 |
| Atf3 | -0.102710 |
| Ehf | -0.106710 |
| Tgif1 | -0.154394 |
81 rows × 1 columns
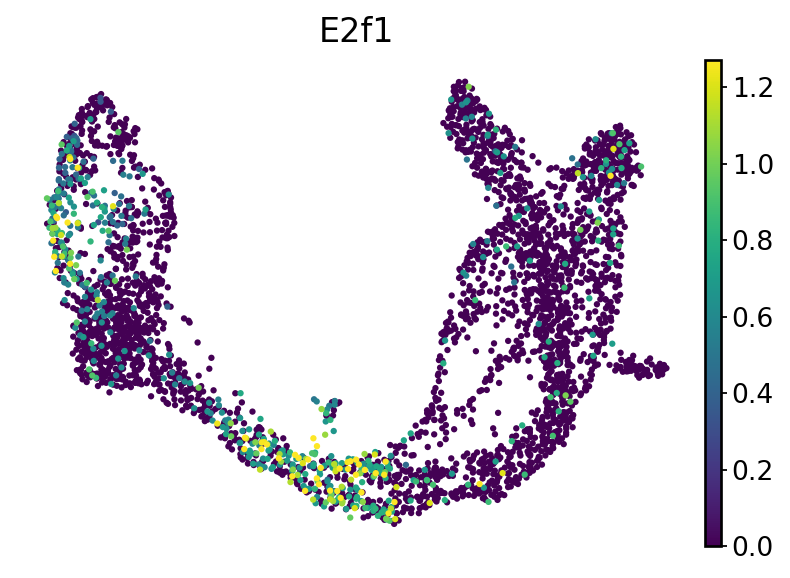
We recovered E2f1 is the top regulator of cell state transition, we can visualize its expression pattern
Perform E2f1 perturbation simulation#
Model loading#
Define reference vector field
vae = REGVELOVI.load(MODEL, adata)
set_output(adata, vae, n_samples=30, batch_size=adata.n_obs)
INFO     File /ictstr01/home/icb/weixu.wang/regulatory_velo/data/pancreatic_endocrine/processed/rgv_model/model.pt
         already downloaded
Simulate perturbation#
adata_perturb, vae_perturb = in_silico_block_simulation(MODEL, adata, "E2f1", effects=0)
INFO     File /ictstr01/home/icb/weixu.wang/regulatory_velo/data/pancreatic_endocrine/processed/rgv_model/model.pt
         already downloaded
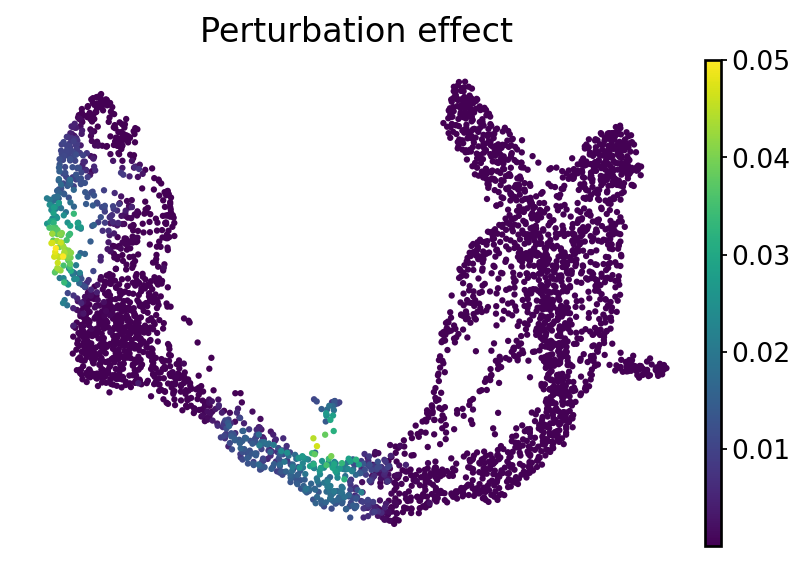
Define local perturbation effects#
ko_effect = cosine_dist(adata.layers["velocity"].T, adata_perturb.layers["velocity"].T)
adata_perturb.obs["perturbation_effect"] = ko_effect
with mplscience.style_context():
    fig, ax = plt.subplots(figsize=(6, 4))
    sc.pl.umap(
        adata_perturb,
        color="perturbation_effect",
        cmap="viridis",
        title="Perturbation effect",
        ax=ax,
        frameon=False,
    )

if SAVE_FIGURES:
    fig.savefig(FIG_DIR / DATASET / "E2f1_perturbation_effect.svg", format="svg", transparent=True, bbox_inches="tight")
    plt.show()
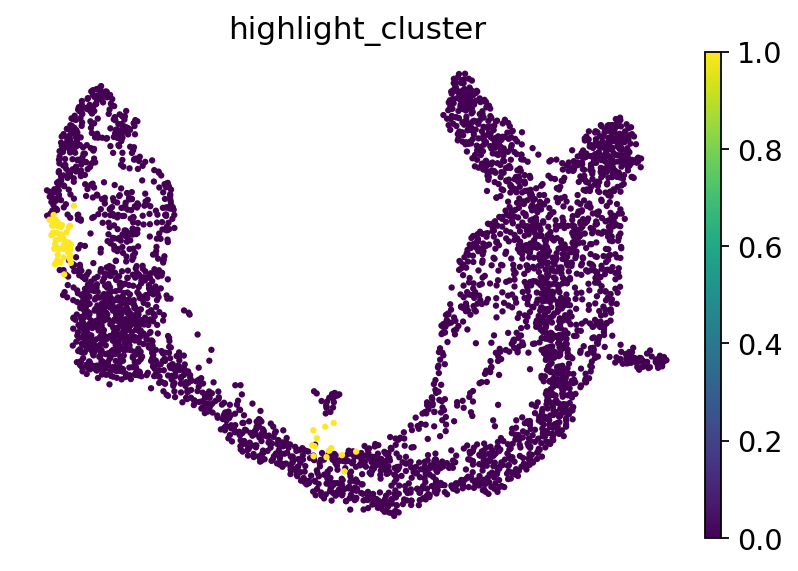
adata_perturb.obs["highlight_cluster"] = 0
adata_perturb.obs["highlight_cluster"][np.array(ko_effect) > 0.03] = 1
sc.pl.umap(
    adata_perturb,
    color="highlight_cluster",
    frameon=False,
)
adata_perturb.obs["s_phase"] = 0
adata_perturb.obs["s_phase"][adata_perturb.obs["phase"] == "S"] = 1
crosstab = pd.crosstab(adata_perturb.obs["highlight_cluster"], adata_perturb.obs["s_phase"], margins=False)
_, p_value = fisher_exact(crosstab, alternative="two-sided")
p_value
6.439914211807307e-40
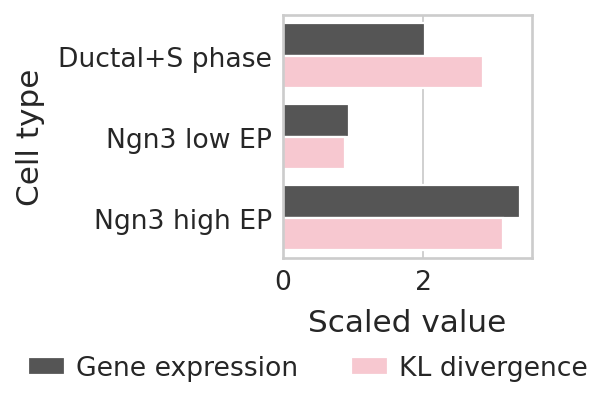
Highlight the inconsistency between perturbation effects and gene expression#
Measuring the average perturbation effects in Ductal, Ngn3 high EP, and Ngn3 low EP (E2f1 is found to be the most highly expressed in these cell types.)
PS = (
    adata_perturb.obs["perturbation_effect"][
        (adata_perturb.obs["clusters"] == "Ductal") & (adata_perturb.obs["phase"] == "S")
    ].tolist()
    + adata_perturb.obs["perturbation_effect"][adata_perturb.obs["clusters"] == "Ngn3 high EP"].tolist()
    + adata_perturb.obs["perturbation_effect"][adata_perturb.obs["clusters"] == "Ngn3 low EP"].tolist()
)
label = (
    [2] * np.sum((adata_perturb.obs["clusters"] == "Ductal") & (adata.obs["phase"] == "S"))
    + [1] * np.sum(adata_perturb.obs["clusters"] == "Ngn3 high EP")
    + [0] * np.sum(adata_perturb.obs["clusters"] == "Ngn3 low EP")
)
# KL = scipy.stats.zscore(KL)
PS = np.array(PS)
PS = [np.mean(PS[np.array(label) == 2]), np.mean(PS[np.array(label) == 0]), np.mean(PS[np.array(label) == 1])]
PS = PS / np.sqrt(np.var(PS))
# scipy.stats.pearsonr(np.array(x),np.array(KL))
PS
array([2.85040192, 0.88865522, 3.13982871])
Measuring gene expression
GEX = (
    adata[(adata.obs["clusters"] == "Ductal") & (adata.obs["phase"] == "S"), "E2f1"].X.A.reshape(-1).tolist()
    + adata[adata.obs["clusters"] == "Ngn3 high EP", "E2f1"].X.A.reshape(-1).tolist()
    + adata[adata.obs["clusters"] == "Ngn3 low EP", "E2f1"].X.A.reshape(-1).tolist()
)
GEX = np.array(GEX)
GEX = [np.mean(GEX[np.array(label) == 2]), np.mean(GEX[np.array(label) == 0]), np.mean(GEX[np.array(label) == 1])]
GEX = GEX / np.sqrt(np.var(GEX))
GEX
array([2.0291548 , 0.94210755, 3.38661677])
## Visualize the effects through the barplot
sns.set_style("ticks")
figsize = (2, 2)
df = pd.DataFrame(GEX.tolist() + PS.tolist())
df.columns = ["Scaled value"]
df["Cell type"] = ["Ductal+S phase", "Ngn3 low EP", "Ngn3 high EP"] * 2
df["Group"] = ["Gene expression"] * 3 + ["KL divergence"] * 3

with mplscience.style_context():
    sns.set_style(style="whitegrid")
    fig, ax = plt.subplots(figsize=figsize)
    sns.barplot(
        data=df,
        x="Scaled value",
        y="Cell type",
        hue="Group",
        ax=ax,
        palette=PALETTE,
    )
    # ax.set(ylim=(-2.1,2.1))
    plt.legend(loc="upper center", bbox_to_anchor=(0.1, -0.3), ncol=2)
    plt.show()

    if SAVE_FIGURES:
        fig.savefig(
            FIG_DIR / DATASET / "perturb_express_compare_e2f1.svg", format="svg", transparent=True, bbox_inches="tight"
        )


