Perturb-seq data analysis#
Notebook for analyzing zebrafish Perturb-seq data.
Library imports#
import numpy as np
import pandas as pd
import scipy

import matplotlib.pyplot as plt
import mplscience
import seaborn as sns

import scanpy as sc
import scvelo as scv

from rgv_tools import DATA_DIR, FIG_DIR
/home/icb/weixu.wang/miniconda3/envs/regvelo_test/lib/python3.10/site-packages/anndata/utils.py:429: FutureWarning: Importing read_csv from `anndata` is deprecated. Import anndata.io.read_csv instead.
  warnings.warn(msg, FutureWarning)
/home/icb/weixu.wang/miniconda3/envs/regvelo_test/lib/python3.10/site-packages/anndata/utils.py:429: FutureWarning: Importing read_excel from `anndata` is deprecated. Import anndata.io.read_excel instead.
  warnings.warn(msg, FutureWarning)
/home/icb/weixu.wang/miniconda3/envs/regvelo_test/lib/python3.10/site-packages/anndata/utils.py:429: FutureWarning: Importing read_hdf from `anndata` is deprecated. Import anndata.io.read_hdf instead.
  warnings.warn(msg, FutureWarning)
/home/icb/weixu.wang/miniconda3/envs/regvelo_test/lib/python3.10/site-packages/anndata/utils.py:429: FutureWarning: Importing read_loom from `anndata` is deprecated. Import anndata.io.read_loom instead.
  warnings.warn(msg, FutureWarning)
/home/icb/weixu.wang/miniconda3/envs/regvelo_test/lib/python3.10/site-packages/anndata/utils.py:429: FutureWarning: Importing read_mtx from `anndata` is deprecated. Import anndata.io.read_mtx instead.
  warnings.warn(msg, FutureWarning)
/home/icb/weixu.wang/miniconda3/envs/regvelo_test/lib/python3.10/site-packages/anndata/utils.py:429: FutureWarning: Importing read_text from `anndata` is deprecated. Import anndata.io.read_text instead.
  warnings.warn(msg, FutureWarning)
/home/icb/weixu.wang/miniconda3/envs/regvelo_test/lib/python3.10/site-packages/anndata/utils.py:429: FutureWarning: Importing read_umi_tools from `anndata` is deprecated. Import anndata.io.read_umi_tools instead.
  warnings.warn(msg, FutureWarning)
General setting#
plt.rcParams["svg.fonttype"] = "none"
sns.reset_defaults()
sns.reset_orig()
scv.settings.set_figure_params("scvelo", dpi_save=400, dpi=80, transparent=True, fontsize=14, color_map="viridis")
Constants#
DATASET = "zebrafish"
SAVE_FIGURES = True
if SAVE_FIGURES:
    (FIG_DIR / DATASET).mkdir(parents=True, exist_ok=True)
Data loading#
adata = sc.read_h5ad(DATA_DIR / DATASET / "raw" / "seu_NC_clustered_normalized.h5ad")
ss3 = sc.read_h5ad(DATA_DIR / DATASET / "processed" / "adata_preprocessed.h5ad")
metadata = pd.read_csv(DATA_DIR / DATASET / "raw" / "metadata.csv", index_col=0)
adata = adata[metadata.index.tolist()]
adata.obs = metadata
Visualize via UMAP#
# Using MELD to calculate sample-associated density estimates and relative likelihood
metadata = adata.obs
metadata["genotype_name"] = metadata["sgRNA_group"]
metadata["genotype"] = metadata["sgRNA_group"]
metadata["replicate"] = "A"
metadata
| orig.ident | nCount_RNA | nFeature_RNA | sample | percent.mt | RNA_snn_res.1 | seurat_clusters | sgRNA_group | DoubletFinder | proj | RNA_snn_res.0.8 | cell_anno | latent_time_imputed | latent_time_imputed_scvi | term_state_imputed | cell_anno_old | genotype_name | genotype | replicate | |
|---|---|---|---|---|---|---|---|---|---|---|---|---|---|---|---|---|---|---|---|
| p1_AAACGGGAGCTAGTTC-1 | SeuratProject | 9374.373090 | 3125 | p1 | 0.601578 | 14 | 14 | fli1a_erf_erfl3 | Singlet | perturbseq | 6 | mNC_head_mesenchymal | 0.599100 | 0.567514 | NaN | mNC_head_mesenchymal | fli1a_erf_erfl3 | fli1a_erf_erfl3 | A |
| p1_AAACGGGCAAAGAATC-1 | SeuratProject | 16617.288939 | 3908 | p1 | 0.752648 | 2 | 2 | fli1a_erf_erfl3 | Singlet | perturbseq | 9 | Pigment_gch2_high | 0.761031 | 0.783371 | NaN | Pigment | fli1a_erf_erfl3 | fli1a_erf_erfl3 | A |
| p1_AAACGGGCAATGTAAG-1 | SeuratProject | 10564.695306 | 3262 | p1 | 0.888390 | 17 | 17 | mitfa_tfec_inhouse | Singlet | perturbseq | 4 | mNC_hox34 | 0.364584 | 0.289242 | NaN | unclassified2 | mitfa_tfec_inhouse | mitfa_tfec_inhouse | A |
| p1_AAACGGGCAGCAGTTT-1 | SeuratProject | 17754.127675 | 3934 | p1 | 0.579913 | 19 | 19 | fli1a_erf_erfl3 | Singlet | perturbseq | 7 | mNC_arch2 | 0.236565 | 0.428227 | NaN | mNC_arch2 | fli1a_erf_erfl3 | fli1a_erf_erfl3 | A |
| p1_AAACGGGGTAGCGTAG-1 | SeuratProject | 15028.838200 | 3638 | p1 | 0.467387 | 6 | 6 | fli1a_erf_erfl3 | Singlet | perturbseq | 5 | unclassified1 | 0.268428 | 0.410988 | NaN | unclassified1 | fli1a_erf_erfl3 | fli1a_erf_erfl3 | A |
| ... | ... | ... | ... | ... | ... | ... | ... | ... | ... | ... | ... | ... | ... | ... | ... | ... | ... | ... | ... |
| p11_TTTGCGCAGAGTAATC-1 | SeuratProject | 6202.170676 | 2499 | p11 | 0.776390 | 8 | 8 | ebf3a | Singlet | perturbseq | 0 | mNC_vagal | 0.387833 | 0.428689 | NaN | Pigment_sox6_high_vagel | ebf3a | ebf3a | A |
| p11_TTTGGTTTCAACTCTT-1 | SeuratProject | 3644.718485 | 1857 | p11 | 1.794744 | 5 | 5 | elf1 | Singlet | perturbseq | 6 | mNC_head_mesenchymal | 0.538755 | 0.549123 | NaN | mNC_head_mesenchymal | elf1 | elf1 | A |
| p11_TTTGGTTTCCTATTCA-1 | SeuratProject | 8422.826902 | 3344 | p11 | 0.510019 | 25 | 25 | nr2f2 | Singlet | perturbseq | 5 | mNC_arch1 | 0.412674 | 0.363753 | NaN | mNC_arch1 | nr2f2 | nr2f2 | A |
| p11_TTTGGTTTCTAACTCT-1 | SeuratProject | 6612.583387 | 2661 | p11 | 0.449287 | 6 | 6 | ebf3a | Singlet | perturbseq | 15 | unclassified1 | 0.259958 | 0.374038 | NaN | unclassified1 | ebf3a | ebf3a | A |
| p11_TTTGTCAAGGACAGCT-1 | SeuratProject | 11372.933636 | 3694 | p11 | 0.594269 | 14 | 14 | multiplet | Singlet | perturbseq | 6 | mNC_head_mesenchymal | 0.489412 | 0.520055 | NaN | mNC_head_mesenchymal | multiplet | multiplet | A |
12393 rows × 19 columns
## Update pigment cell annotation
adata.obs["cell_anno_new"] = adata.obs["cell_anno"].copy()
adata.obs["cell_anno_new"][adata.obs["cell_anno_new"] == "Pigment_gch2_high"] = "Pigment"
perturbseq = adata[
    adata.obs["sgRNA_group"].isin(
        [
            "mitfa_tfec_inhouse",
            "negative",
            "control",
            "mitfa",
            "tfec",
            "tfec_mitfa_bhlhe40",
            "mitfa_tfec",
            "mitfa_tfec_tfeb",
            "elf1",
            "nr2f2",
            "nr2f5",
        ]
    )
].copy()

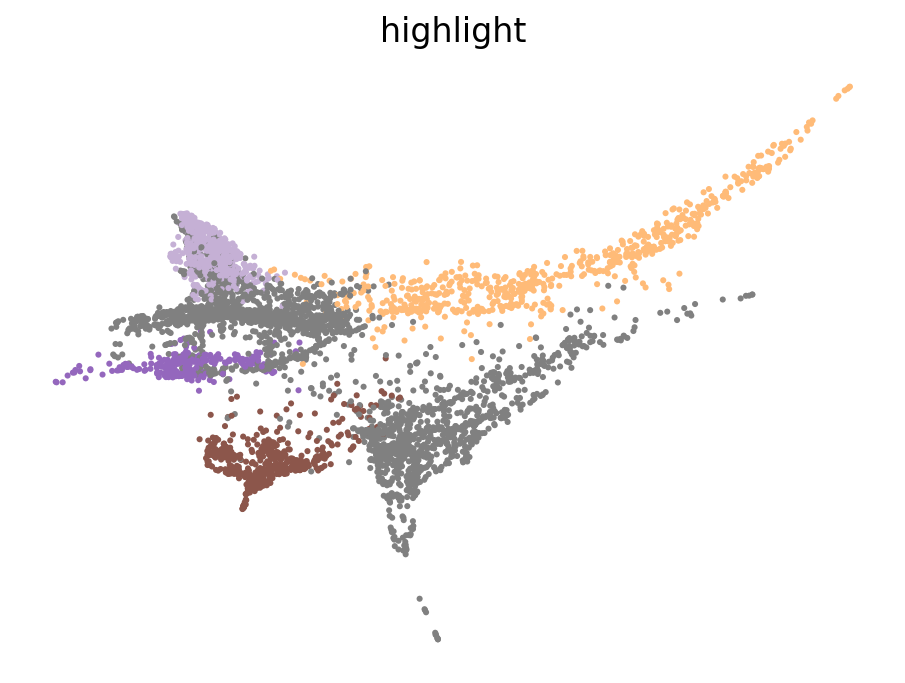
highlight_cell_types = [
    "mNC_hox34",
    "mNC_head_mesenchymal",
    "mNC_arch2",
    "Pigment",
    "Other",
]  # replace with your cell types of interest

# Create a new column for colors
perturbseq.obs["highlight"] = perturbseq.obs["cell_anno_new"].copy()
palette = dict(zip(ss3.obs["cell_type"].cat.categories, ss3.uns["cell_type_colors"]))
# Set cell types to grey if they are not in the highlight list
perturbseq.obs["highlight"] = perturbseq.obs["highlight"].apply(lambda x: x if x in highlight_cell_types else "Other")

# Create a color map where 'Other' is grey
colors = ["grey" if ct == "Other" else palette[ct] for i, ct in enumerate(highlight_cell_types)]
color_map = {ct: color for ct, color in zip(highlight_cell_types, colors)}
color_map["Other"] = "grey"
with mplscience.style_context():
    fig, ax = plt.subplots(figsize=(7, 5))
    sc.pl.embedding(
        perturbseq, color="highlight", basis="phate", legend_loc=None, palette=color_map, frameon=False, size=30, ax=ax
    )

    if SAVE_FIGURES:
        fig.savefig(FIG_DIR / DATASET / "INTRO_figure_perturb.svg", format="svg", transparent=True, bbox_inches="tight")
    plt.show()
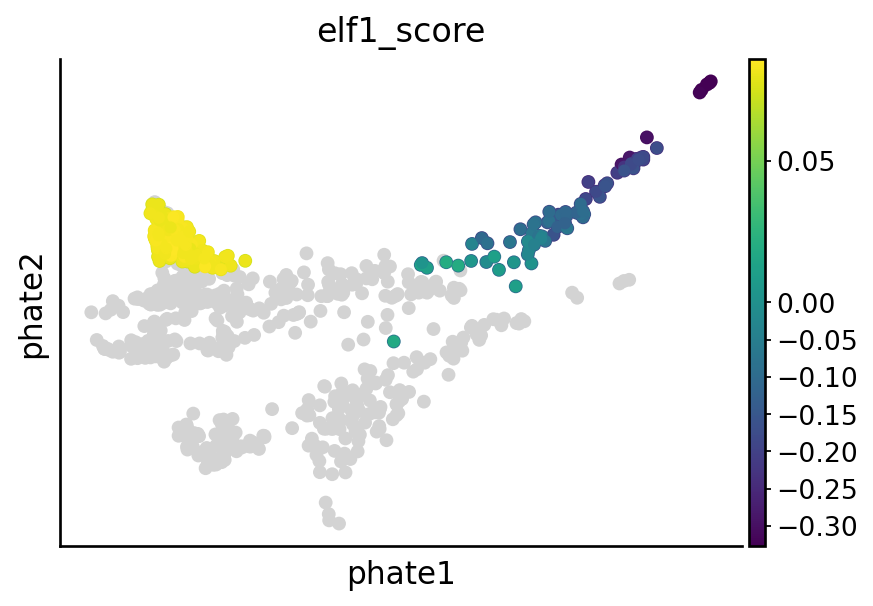
Visualize nr2f2, tfec, mitfa and elf1 perturbation effect#
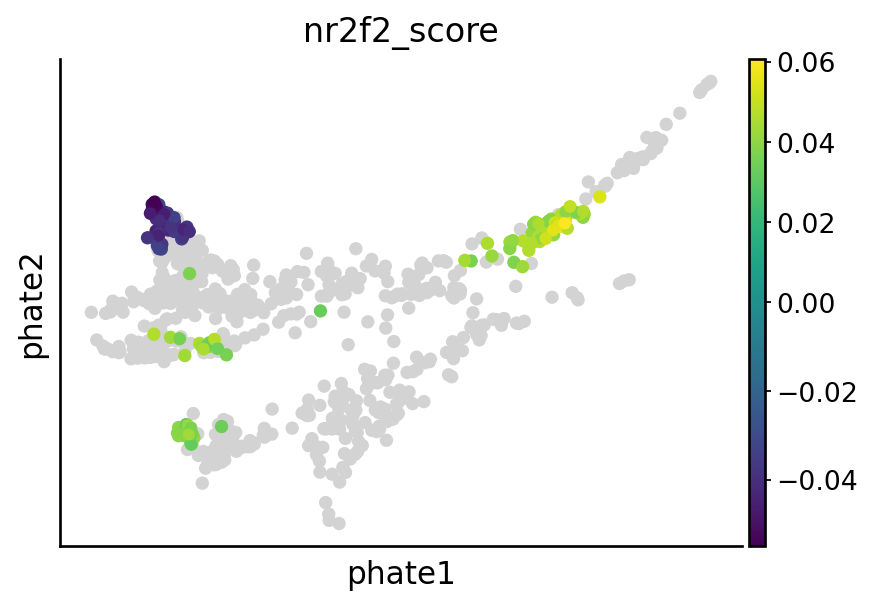
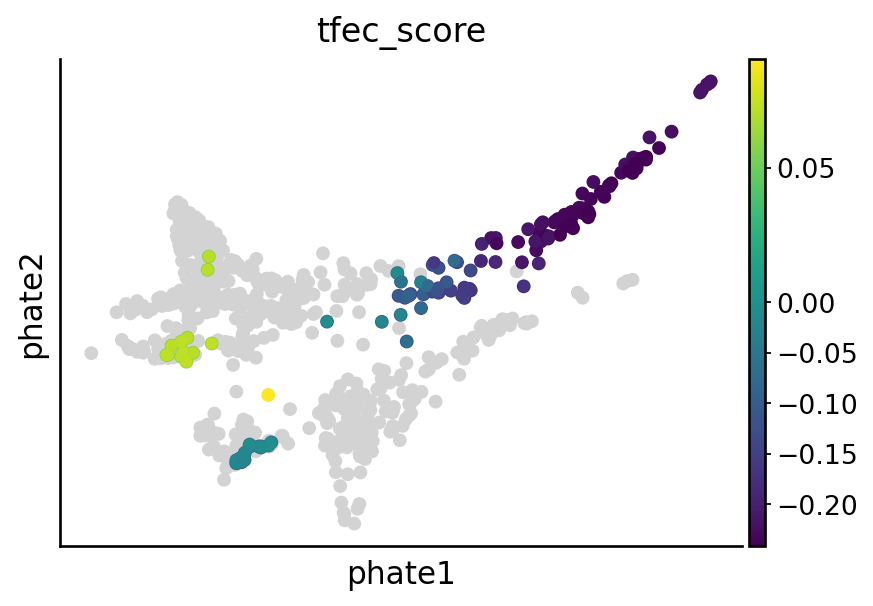
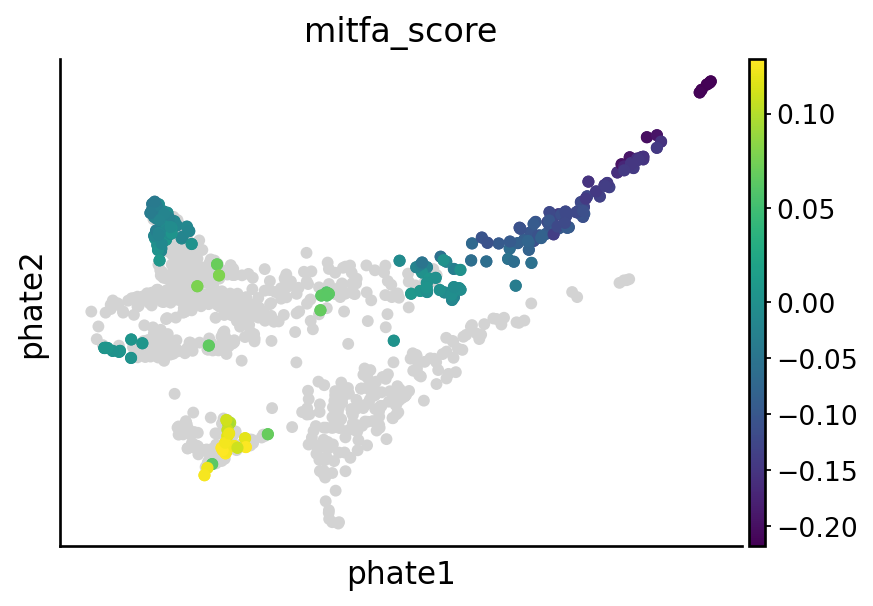
sgRNA_groups = ["nr2f2", "tfec", "mitfa", "elf1"]
# Visualize the perturbation on terminal states
cell_types = [
    "mNC_hox34",
    "mNC_head_mesenchymal",
    "mNC_arch2",
    "Pigment",
]

for group in sgRNA_groups:
    sample_likelihoods = pd.read_csv(DATA_DIR / DATASET / "raw" / f"likelihood_{group}.csv", index_col=0)
    condition = (metadata["sgRNA_group"] == "control") | (metadata["sgRNA_group"] == group)
    experimental_samples = [f"{group}A", f"{group}B"]

    df = pd.DataFrame(sample_likelihoods[experimental_samples])
    df[group] = df.mean(1)
    # Calculate the percentiles values

    down = df[group].quantile(0.2)
    up = df[group].quantile(0.8)

    # Apply the condition to set values outside the 5th and 95th percentiles to NaN
    df["quantile_value"] = np.where((df[group] > up) | (df[group] < down), df[group], np.nan)
    df["quantile_value"] = df["quantile_value"] - np.mean(df[group])

    vec = adata[condition].obs["cell_anno_new"].apply(lambda x: 1 if x in cell_types else np.nan)
    df["quantile_value"] = np.array(df["quantile_value"]) * np.array(vec)

    adata_sub = adata[condition].copy()
    adata_sub.obs[f"{group}_score"] = np.array(df["quantile_value"]).copy()

    ## Plot the figure
    overall_score = pd.DataFrame({"score": np.array([np.nan] * adata_sub.shape[0])})
    overall_score.index = adata_sub.obs.index.tolist()
    overall_score.loc[adata_sub.obs.index.tolist(), "score"] = np.array(adata_sub.obs[f"{group}_score"])

    adata_sub.obs[f"{group}_score"] = np.array(overall_score["score"])
    adata_sub.obs["highlight"] = (~np.isnan(adata_sub.obs[f"{group}_score"])).astype(str)

    highlighted_points = adata_sub[adata_sub.obs["highlight"] == "True"]
    x_highlight = highlighted_points.obsm["X_phate"][:, 0]
    y_highlight = highlighted_points.obsm["X_phate"][:, 1]
    color_values = highlighted_points.obs[f"{group}_score"]  # Adjust to your continuous variable

    with mplscience.style_context():  # Use the mplscience style context
        fig, ax = plt.subplots(figsize=(6, 4))

        sc.pl.embedding(adata_sub, basis="phate", color=f"{group}_score", vcenter=0, show=False, ax=ax)
        plt.scatter(
            x_highlight,
            y_highlight,
            c=color_values,
            cmap="viridis",  # Choose a gradient color map, e.g., 'viridis', 'plasma', 'inferno', etc.
            s=20,  # Larger size for highlighted points
            # edgecolor='black',  # Optional: border for emphasis
        )

        if SAVE_FIGURES:
            fig.savefig(
                FIG_DIR / DATASET / f"{group}_perturbation.svg", format="svg", transparent=True, bbox_inches="tight"
            )
        plt.show()
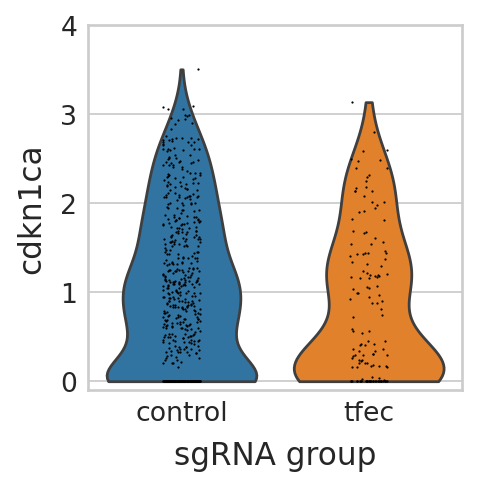
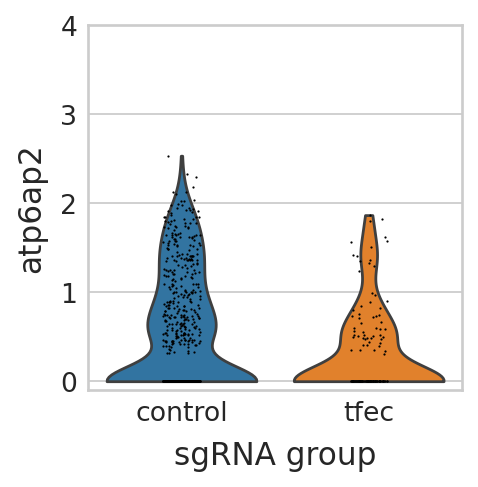
Visualize differential expressed genes in tfec perturbation panel#
perturbseq = adata.copy()
perturbseq = perturbseq[
    ~perturbseq.obs["cell_anno_new"].isin(["unclassified2", "unclassified1", "Mutant_hox23", "Mutant"]),
]
seu_small = perturbseq[perturbseq.obs["sgRNA_group"].isin(["control", "tfec"]),]
genotype = seu_small.obs["sgRNA_group"].tolist()
with mplscience.style_context():  # Use the mplscience style context
    sns.set_style(style="whitegrid")
    fig, ax = plt.subplots(figsize=(3, 3))

    # Create the scatter plot
    sc.pl.violin(seu_small, ["cdkn1ca"], multi_panel=False, groupby="sgRNA_group", stripplot=True, ax=ax, show=False)
    ax.set_ylim(bottom=-0.1, top=4)

    if SAVE_FIGURES:
        fig.savefig(FIG_DIR / DATASET / "cdkn1ca.svg", format="svg", transparent=True, bbox_inches="tight")

    # Display the plot
    plt.show()
with mplscience.style_context():  # Use the mplscience style context
    sns.set_style(style="whitegrid")
    fig, ax = plt.subplots(figsize=(3, 3))

    # Create the scatter plot
    sc.pl.violin(seu_small, ["atp6ap2"], multi_panel=False, groupby="sgRNA_group", stripplot=True, ax=ax, show=False)
    ax.set_ylim(bottom=-0.1, top=4)

    if SAVE_FIGURES:
        fig.savefig(FIG_DIR / DATASET / "atp6ap2.svg", format="svg", transparent=True, bbox_inches="tight")

    # Display the plot
    plt.show()
test significance#
scipy.stats.ttest_ind(
    seu_small[np.array(genotype) == "tfec", "cdkn1ca"].X.toarray().reshape(-1),
    seu_small[np.array(genotype) != "tfec", "cdkn1ca"].X.toarray().reshape(-1),
    equal_var=False,
    alternative="less",
)
TtestResult(statistic=-2.0416193271649687, pvalue=0.021191380003823368, df=219.9875671451483)
scipy.stats.ttest_ind(
    seu_small[np.array(genotype) == "tfec", "atp6ap2"].X.toarray().reshape(-1),
    seu_small[np.array(genotype) != "tfec", "atp6ap2"].X.toarray().reshape(-1),
    equal_var=False,
    alternative="less",
)
TtestResult(statistic=-5.547499181077916, pvalue=3.4438545499844835e-08, df=270.9981680245929)
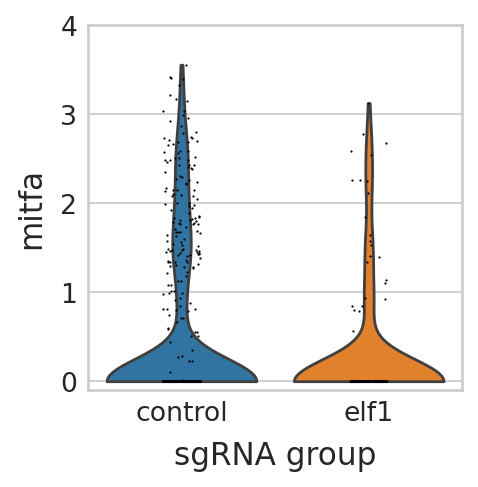
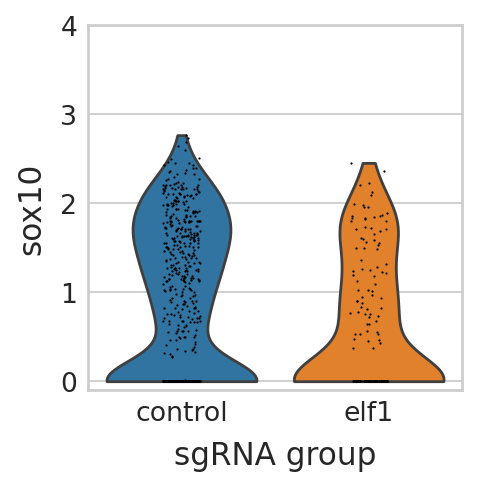
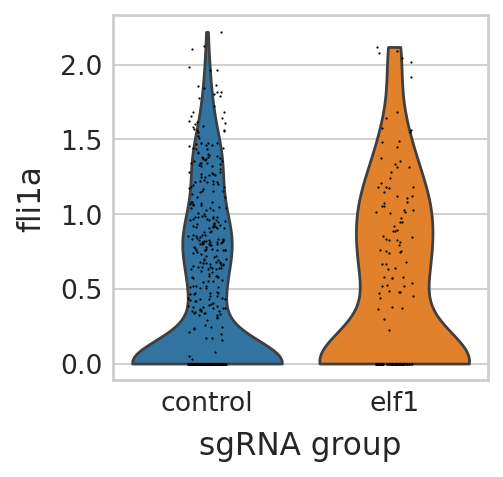
Visualize differential expressed genes in elf1 perturbation panel#
perturbseq = adata.copy()
perturbseq = perturbseq[
    ~perturbseq.obs["cell_anno_new"].isin(["unclassified2", "unclassified1", "Mutant_hox23", "Mutant"]),
]
seu_small = perturbseq[perturbseq.obs["sgRNA_group"].isin(["control", "elf1"]),]
genotype = seu_small.obs["sgRNA_group"].tolist()
with mplscience.style_context():  # Use the mplscience style context
    sns.set_style(style="whitegrid")
    fig, ax = plt.subplots(figsize=(3, 3))

    # Create the scatter plot
    sc.pl.violin(seu_small, ["mitfa"], multi_panel=False, groupby="sgRNA_group", stripplot=True, ax=ax, show=False)
    ax.set_ylim(bottom=-0.1, top=4)

    if SAVE_FIGURES:
        fig.savefig(
            FIG_DIR / DATASET / "mitfa_expression_elf1_knockout.svg",
            format="svg",
            transparent=True,
            bbox_inches="tight",
        )

    # Display the plot
    plt.show()
with mplscience.style_context():  # Use the mplscience style context
    sns.set_style(style="whitegrid")
    fig, ax = plt.subplots(figsize=(3, 3))

    # Create the scatter plot
    sc.pl.violin(seu_small, ["sox10"], multi_panel=False, groupby="sgRNA_group", stripplot=True, ax=ax, show=False)
    ax.set_ylim(bottom=-0.1, top=4)

    if SAVE_FIGURES:
        fig.savefig(
            FIG_DIR / DATASET / "sox10_expression_elf1_knockout.svg",
            format="svg",
            transparent=True,
            bbox_inches="tight",
        )

    # Display the plot
    plt.show()
with mplscience.style_context():  # Use the mplscience style context
    sns.set_style(style="whitegrid")
    fig, ax = plt.subplots(figsize=(3, 3))

    # Create the scatter plot
    sc.pl.violin(seu_small, ["fli1a"], multi_panel=False, groupby="sgRNA_group", stripplot=True, ax=ax, show=False)

    if SAVE_FIGURES:
        fig.savefig(
            FIG_DIR / DATASET / "fli1a_expression_elf1_knockout.svg",
            format="svg",
            transparent=True,
            bbox_inches="tight",
        )

    # Display the plot
    plt.show()
test significance#
scipy.stats.ttest_ind(
    seu_small[np.array(genotype) == "elf1", "mitfa"].X.toarray().reshape(-1),
    seu_small[np.array(genotype) != "elf1", "mitfa"].X.toarray().reshape(-1),
    equal_var=False,
    alternative="less",
)
TtestResult(statistic=-3.429003795549063, pvalue=0.0003452279743702678, df=300.522449116822)
scipy.stats.ttest_ind(
    seu_small[np.array(genotype) == "elf1", "sox10"].X.toarray().reshape(-1),
    seu_small[np.array(genotype) != "elf1", "sox10"].X.toarray().reshape(-1),
    equal_var=False,
    alternative="less",
)
TtestResult(statistic=-4.108995730134873, pvalue=2.6789127768845648e-05, df=255.2575590451451)
scipy.stats.ttest_ind(
    seu_small[np.array(genotype) == "elf1", "fli1a"].X.toarray().reshape(-1),
    seu_small[np.array(genotype) != "elf1", "fli1a"].X.toarray().reshape(-1),
    equal_var=False,
    alternative="greater",
)
TtestResult(statistic=1.3860128076275413, pvalue=0.0835617324921002, df=223.63128948496157)
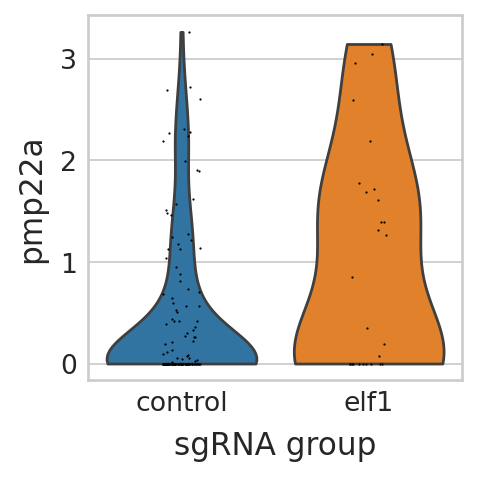
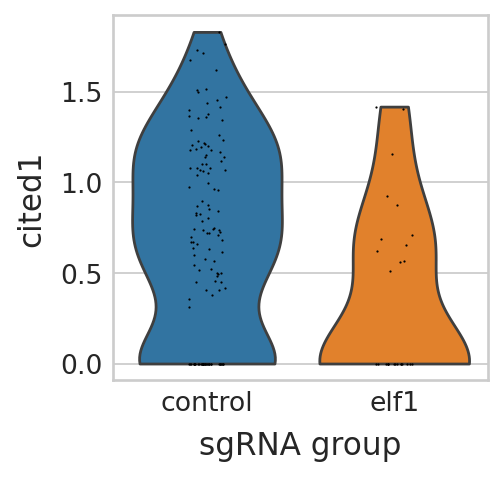
Visualize differential expressed genes in pigment cell lineage of elf1 perturbation panel#
perturbseq = adata.copy()
perturbseq = perturbseq[perturbseq.obs["cell_anno_new"].isin(["Pigment"]),]
seu_small = perturbseq[perturbseq.obs["sgRNA_group"].isin(["control", "elf1"]),]
genotype = seu_small.obs["sgRNA_group"].tolist()
with mplscience.style_context():  # Use the mplscience style context
    sns.set_style(style="whitegrid")
    fig, ax = plt.subplots(figsize=(3, 3))

    # Create the scatter plot
    sc.pl.violin(seu_small, ["pmp22a"], multi_panel=False, groupby="sgRNA_group", stripplot=True, ax=ax, show=False)

    if SAVE_FIGURES:
        fig.savefig(
            FIG_DIR / DATASET / "pmp22a_expression_elf1_knockout.svg",
            format="svg",
            transparent=True,
            bbox_inches="tight",
        )

    # Display the plot
    plt.show()
with mplscience.style_context():  # Use the mplscience style context
    sns.set_style(style="whitegrid")
    fig, ax = plt.subplots(figsize=(3, 3))

    # Create the scatter plot
    sc.pl.violin(seu_small, ["cited1"], multi_panel=False, groupby="sgRNA_group", stripplot=True, ax=ax, show=False)

    if SAVE_FIGURES:
        fig.savefig(
            FIG_DIR / DATASET / "cited1_expression_elf1_knockout.svg",
            format="svg",
            transparent=True,
            bbox_inches="tight",
        )

    # Display the plot
    plt.show()
with mplscience.style_context():  # Use the mplscience style context
    sns.set_style(style="whitegrid")
    fig, ax = plt.subplots(figsize=(3, 3))

    # Create the scatter plot
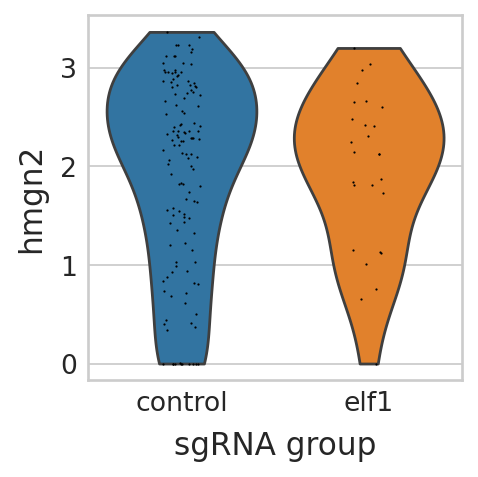
    sc.pl.violin(seu_small, ["hmgn2"], multi_panel=False, groupby="sgRNA_group", stripplot=True, ax=ax, show=False)

    if SAVE_FIGURES:
        fig.savefig(
            FIG_DIR / DATASET / "hmgn2_expression_elf1_knockout.svg",
            format="svg",
            transparent=True,
            bbox_inches="tight",
        )

    # Display the plot
    plt.show()
with mplscience.style_context():  # Use the mplscience style context
    sns.set_style(style="whitegrid")
    fig, ax = plt.subplots(figsize=(3, 3))

    # Create the scatter plot
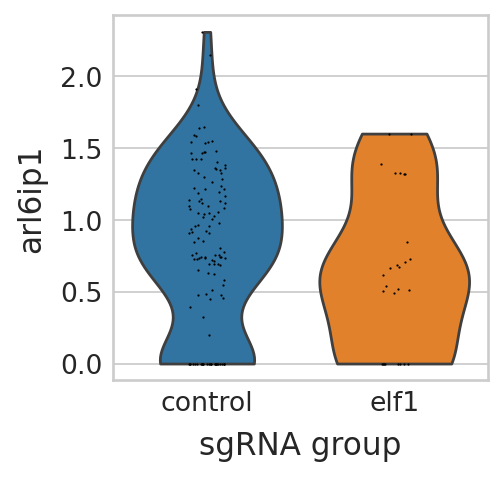
    sc.pl.violin(seu_small, ["arl6ip1"], multi_panel=False, groupby="sgRNA_group", stripplot=True, ax=ax, show=False)

    if SAVE_FIGURES:
        fig.savefig(
            FIG_DIR / DATASET / "arl6ip1_expression_elf1_knockout.svg",
            format="svg",
            transparent=True,
            bbox_inches="tight",
        )

    # Display the plot
    plt.show()
Visualize elf1 gene expression change when knockout tfec and fli1a#
knockout tfec#
perturbseq = adata.copy()
perturbseq = perturbseq[
    ~perturbseq.obs["cell_anno_new"].isin(["unclassified2", "unclassified1", "Mutant_hox23", "Mutant"]),
]
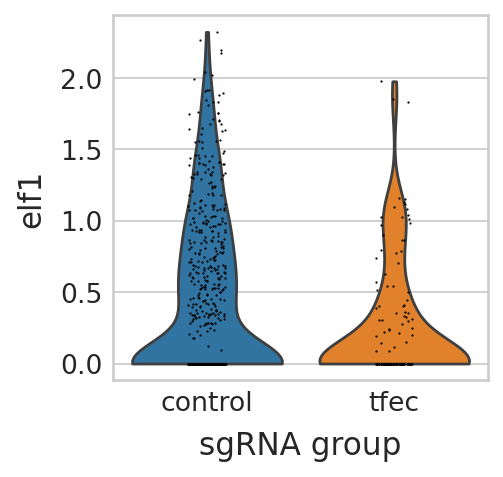
seu_small = perturbseq[perturbseq.obs["sgRNA_group"].isin(["control", "tfec"]),]
genotype = seu_small.obs["sgRNA_group"].tolist()
with mplscience.style_context():  # Use the mplscience style context
    sns.set_style(style="whitegrid")
    fig, ax = plt.subplots(figsize=(3, 3))

    # Create the scatter plot
    sc.pl.violin(seu_small, ["elf1"], multi_panel=False, groupby="sgRNA_group", stripplot=True, ax=ax, show=False)

    if SAVE_FIGURES:
        fig.savefig(
            FIG_DIR / DATASET / "elf1_expression_tfec_knockout.svg", format="svg", transparent=True, bbox_inches="tight"
        )

    # Display the plot
    plt.show()
test significance#
scipy.stats.ttest_ind(
    seu_small[np.array(genotype) == "tfec", "elf1"].X.toarray().reshape(-1),
    seu_small[np.array(genotype) != "tfec", "elf1"].X.toarray().reshape(-1),
    equal_var=False,
    alternative="less",
)
TtestResult(statistic=-5.366020270431321, pvalue=8.610173685738961e-08, df=272.49193453818)
knockout fli1a#
perturbseq = adata.copy()
perturbseq = perturbseq[
    ~perturbseq.obs["cell_anno_new"].isin(["unclassified2", "unclassified1", "Mutant_hox23", "Mutant"]),
]
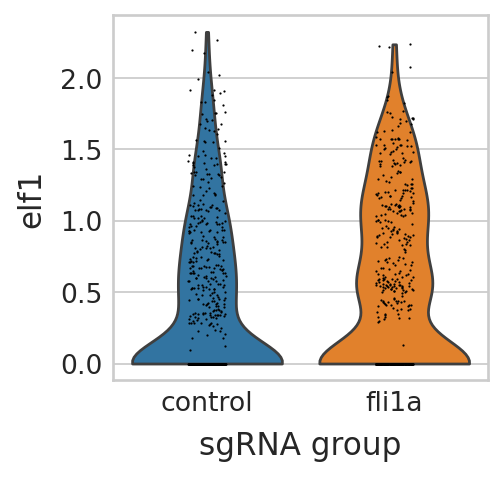
seu_small = perturbseq[perturbseq.obs["sgRNA_group"].isin(["control", "fli1a"]),]
genotype = seu_small.obs["sgRNA_group"].tolist()
with mplscience.style_context():  # Use the mplscience style context
    sns.set_style(style="whitegrid")
    fig, ax = plt.subplots(figsize=(3, 3))

    # Create the scatter plot
    sc.pl.violin(seu_small, ["elf1"], multi_panel=False, groupby="sgRNA_group", stripplot=True, ax=ax, show=False)

    if SAVE_FIGURES:
        fig.savefig(
            FIG_DIR / DATASET / "elf1_expression_fli1a_knockout.svg",
            format="svg",
            transparent=True,
            bbox_inches="tight",
        )

    # Display the plot
    plt.show()
test significance#
scipy.stats.ttest_ind(
    seu_small[np.array(genotype) == "fli1a", "elf1"].X.toarray().reshape(-1),
    seu_small[np.array(genotype) != "fli1a", "elf1"].X.toarray().reshape(-1),
    equal_var=False,
    alternative="greater",
)
TtestResult(statistic=3.059975496268048, pvalue=0.0011362106276185085, df=1002.4934192631699)
